How CABA Design Co. Scaled Google Ads By 50% With Certainty of ROI
connected
per month
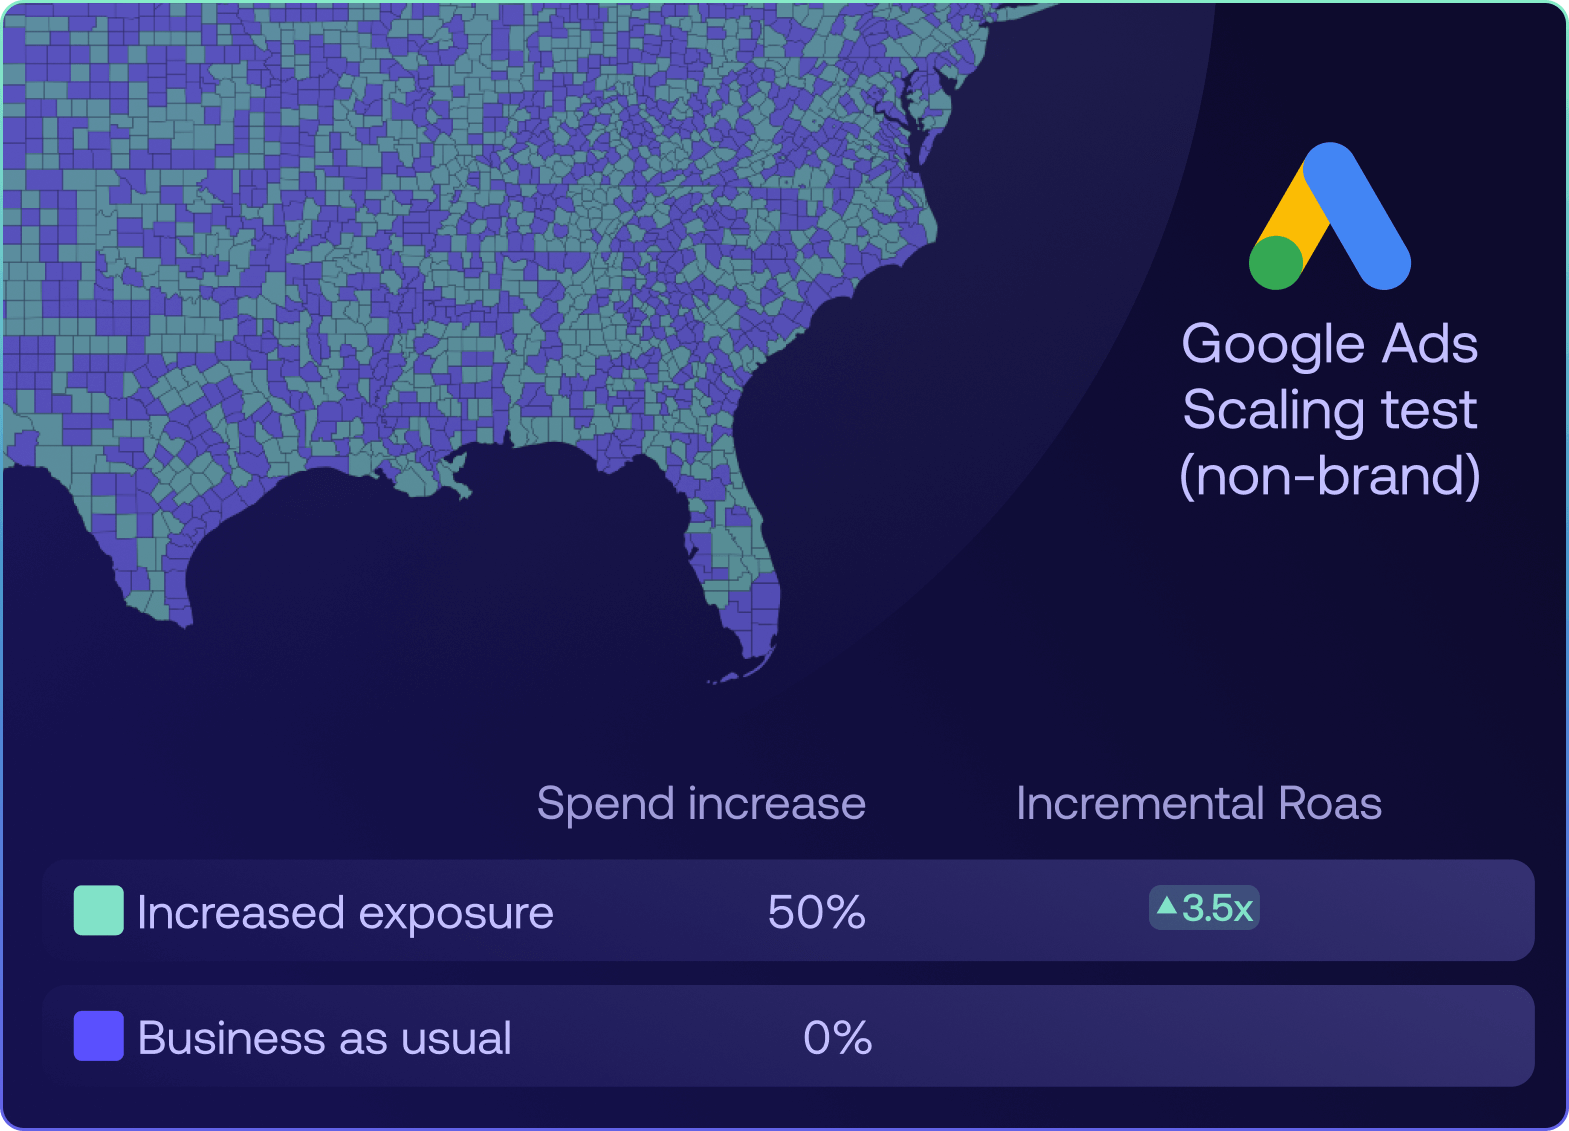
Results at a Glance
- +50% increase in non-brand Google Ads budget tested
- Incremental ROAS estimated at 3.45x with confidence
- Estimated Cost per Order adjustments of both high-value and swatch/sample orders confirmed within tolerable range for scaling
- Test results were validated by Google’s own models
Main Takeaway: Polar and CABA Design Co. were able to demonstrate an incremental cost per purchase and incremental ROAS that met the team’s thresholds for scaling.
Challenge
CABA Design Co. came to a familiar crossroads: leadership wanted to scale Google Ads ahead of key sales moments, but the team needed evidence that extra dollars would drive incremental revenue - not just prettier platform dashboards.
Traditional platform attribution offered conflicting answers (first-click vs. last-click vs. linear), and period-level analyses blurred lagged effects. The real question was simple and high-stakes: If we spend more, how much new value do we create?
“We had conviction to scale, but not the proof to back it. Without incrementality, every dollar felt like a guess.” CEO, CABA Design Co.
“We didn’t want a prettier report. We wanted to know if extra ad spend actually brought in new sales. Polar made that clear.”

Solution
CABA worked with Polar to run a clear budget-lift test.
.png)
How the test worked
- Twin Geo Modeling: We used two sets of twin geographies by US market (Nielsen DMA). 80% of the markets received no increase in spend, while 20% of the markets, representing a “twin geo” received a 50% increase in spend.
- Day-by-day modeling: Ads don’t only work the day you spend. They can lift sales for a few days after. Polar’s model accounts for that lag and fade, so the results aren’t skewed.
- Multiple lenses: We looked at overall sales, revenue, sample/swatch orders and traffic metrics (such as sessions with add-to-cart events) - then rolled these views up into one confident answer.
- Sanity check: We compared the incremental result to Google’s own attribution styles (first click, last click, blended) to make sure the story matched reality.
What Polar brought
- Twin Geo Modeling to ensure both the holdout and treatment segments represented identical compositions for confident testing
- Fast, measurable results - Polar’s Twin Geo Modeling only required a 20% treatment to reach significance
- End-to-end deployment - Polar built the geos, uploaded to Google and reported on the results
- Clean, first-party tracking so missing or double-counted orders don’t warp results
- Opinionated ecommerce modeling that turns messy data into a simple “what changed because of the extra spend?” answer
- Clear dashboards with a daily lift curve and confidence bands, so leaders can approve budgets without guesswork
“Seeing the daily lift curve made the decision easy. We could point to where the extra spend actually paid off.” - CEO, CABA Design Co.
Results
The headline: The extra budget worked.
- The incremental return from the spend increase landed at a confident estimate of 3.45x
- On high-value orders, cost per order improved by ~33% when we accounted for how ads lift sales over several days.
- For lower-value sample orders, costs improved by ~10%, helping paid traffic pay back faster.
- Cost-per-swatch order was estimated to remain in the acceptable range as spend scales
Why the team trusted it
- The best estimate lined up between Google’s common attribution views - exactly where an honest incremental read should land.
- The numbers held together across different outcomes (orders, samples, traffic), not just one metric.
What changed next
- The team immediately moved to testing incrementality of TikTok Ads spend.
- Budget approvals now use day-level lift instead of one-off ROAS screenshots.
- The team kept scaling with guardrails, confident the extra spend creates real new revenue - not just nicer dashboards.
“It has been very helpful calibrating incremental lift with MTA to ensure our budgets follow the truth.” - CEO, CABA Design Co.
The fastest growing Shopify brands use Polar Analytics