5 Problems a Semantic Layer Solves (That You Didn't Know You Had)
TL;DR
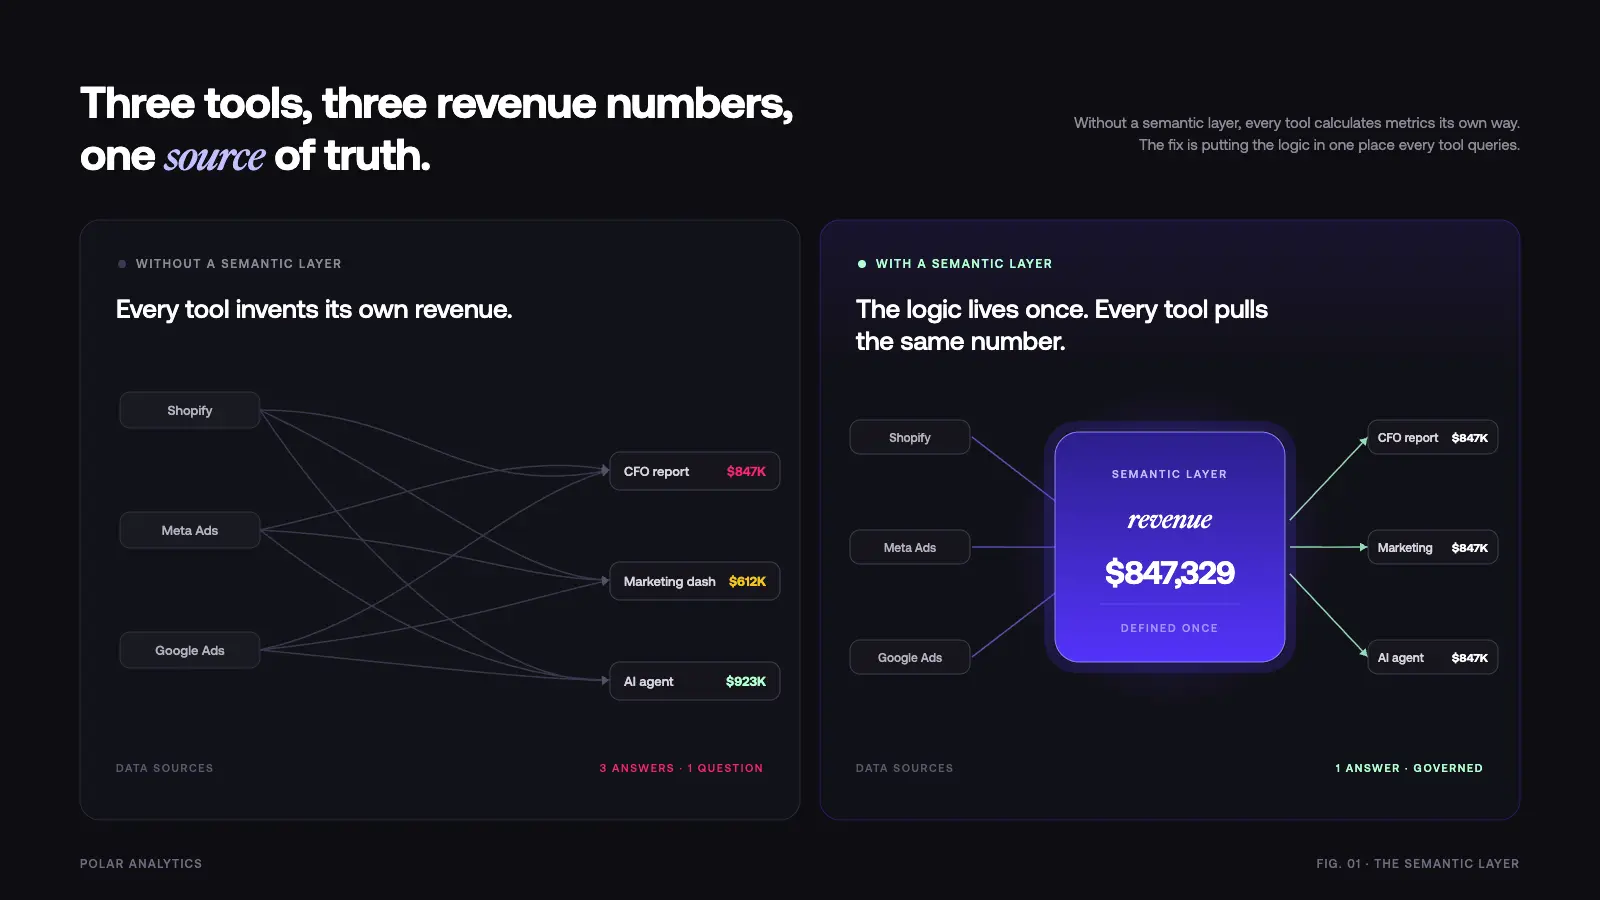
Your dashboards lie to you every day. Not on purpose but because nobody agreed on what “revenue” means. One dashboard pulls Shopify revenue. Another pulls ad platform conversion value. A third calculates it from raw tables in your cloud warehouse. Three different numbers. Same company. Same question. Three different answers.
This is not a tracking problem. This is not a data quality problem. This is a semantic layer problem. The logic that defines your metrics lives scattered across SQL, BI tools, spreadsheets, and the heads of individual team members. When someone asks a simple question, they get a different answer depending on who built the query they are looking at.
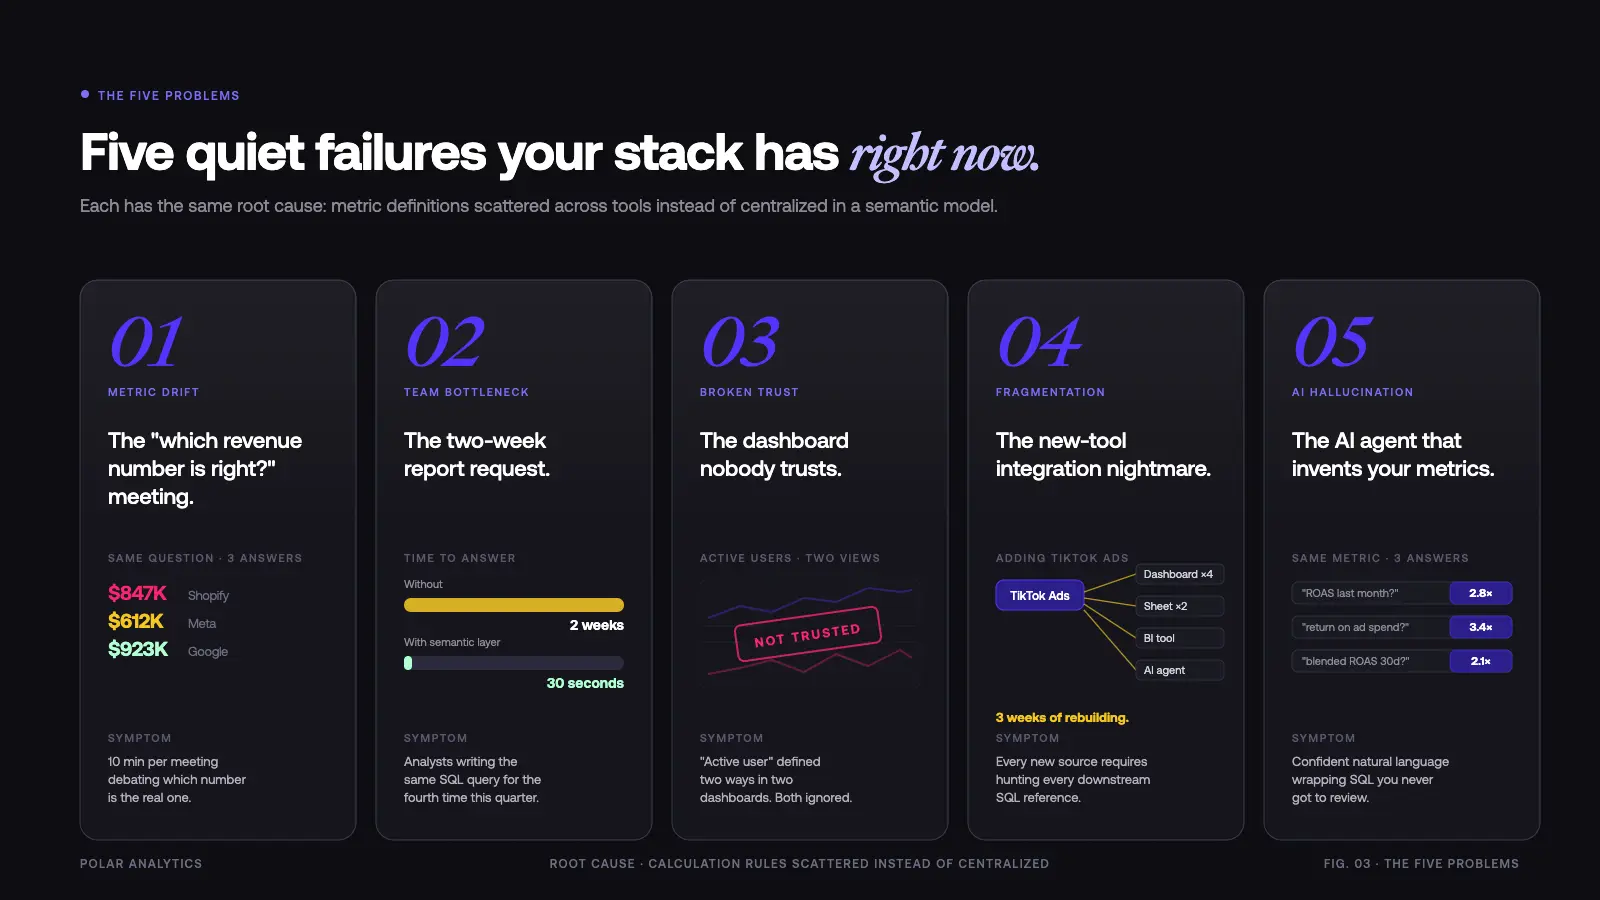
Here are five issues you almost certainly have right now and why a semantic layer is the only proper fix for each of them.
Problem 1: The “Which Revenue Number Is Right?” Meeting
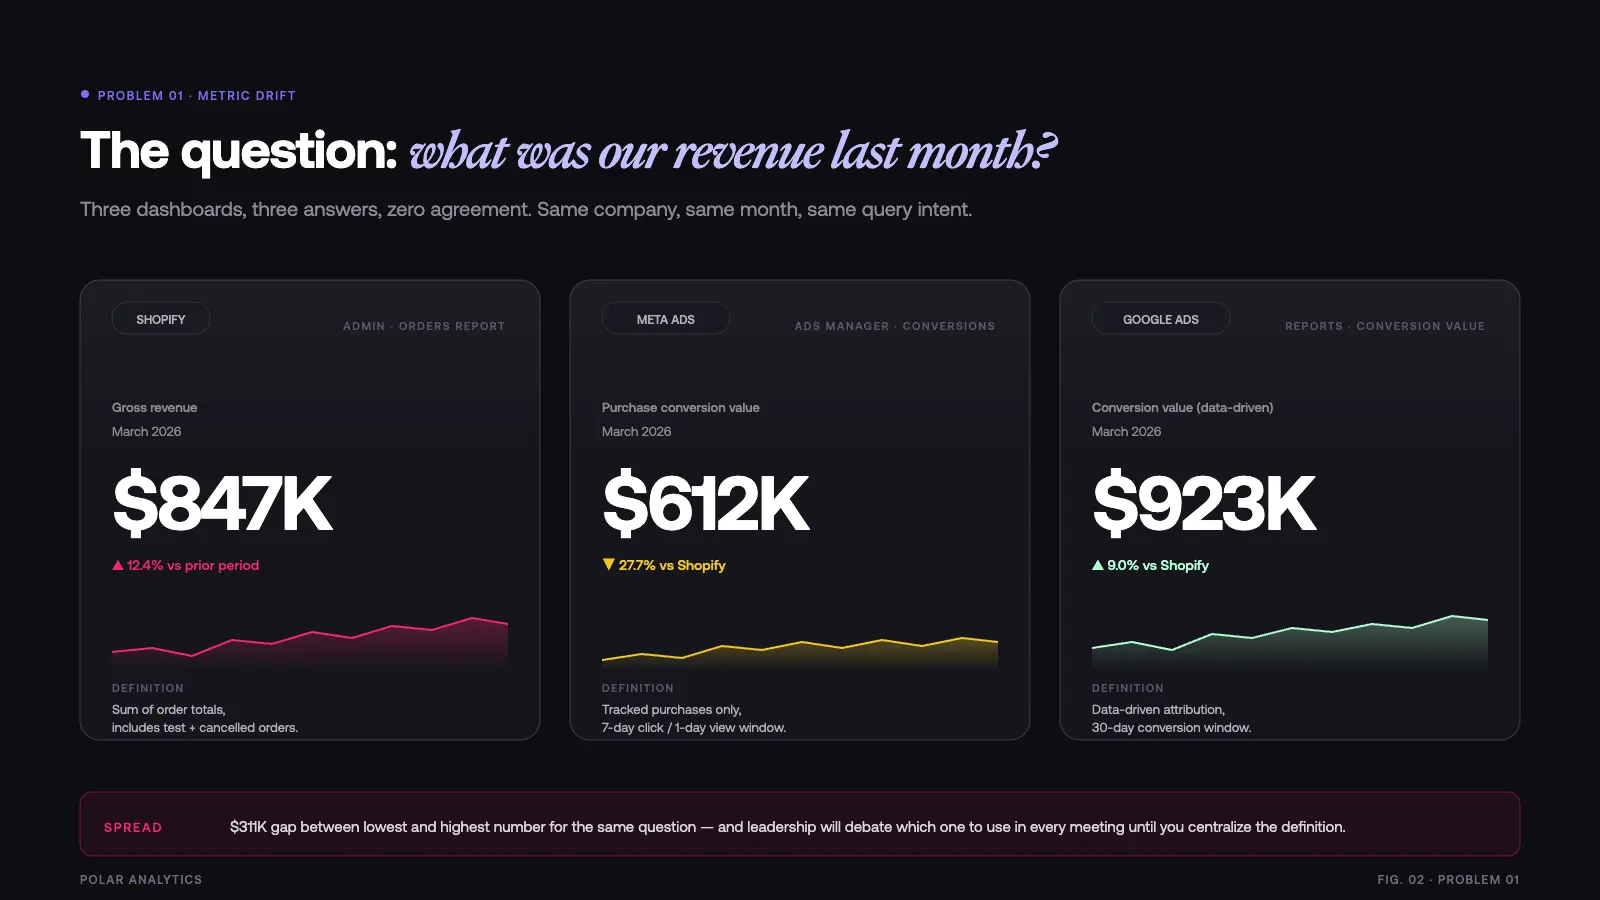
What it looks like: Every leadership meeting includes a detour where someone asks “wait, which revenue number are we using?” Someone pulls up Shopify. Someone else pulls up Google Ads. Someone pulls up the CFO’s report. They are all different. Ten minutes are spent debating which one is correct.
Why it happens: Metric specifications are scattered across your reporting stack. Each tool calculates revenue differently: Shopify includes all orders, Meta includes only tracked conversions, Google uses conversion value with its own attribution rules. Nobody owns the formula. There is no single source of truth for your key business terms.
The deeper issue is that your organization lacks data management standards around these specifications. Every time a new analyst joined the team, they wrote their own SQL against the raw tables. Every time you added a new reporting tool, it came with its own way of modeling your metrics. Over time, your stack developed a proliferation of competing semantic descriptions for the same concepts.
How a semantic layer fixes it: The semantic layer specifies revenue once: gross sales minus returns minus discounts from Shopify, excluding test orders, for the selected date range. Every tool dashboards, reports, AI agents, chatbots pulls from that same specification stored in the semantic model. Users see one number. The meeting moves on.
This is the core value of proper data governance: business terms and their meanings live in one place, managed by the data team, versioned like code. When the CFO asks “what is our revenue?” the semantic layer translates that question into the correct SQL query against your cloud store, every time, without ambiguity.
Problem 2: The Two-Week Report Request
What it looks like: Marketing asks for a ROAS-by-channel breakdown. The data team says they will get to it in two weeks. Two weeks later, the request has shifted priority. A month later, someone builds it in a spreadsheet using average numbers they vaguely remember. Decisions get made on figures nobody verified.
Why it happens: Every new request requires an analytics engineer to write SQL from scratch, specify the metrics, validate the numbers against existing data models, and build the visualization. The team is the bottleneck between users and insights. The complexity of your cloud warehouse means even simple questions require significant developer skill to answer properly.
Most organizations operating without a semantic layer have hundreds of one-off SQL queries floating around. Some live in their BI tool. Some live in a data catalog nobody maintains. Some live in individuals’ local files. When someone asks a question that was answered six months ago by a different analyst, the knowledge does not transfer. The work gets done again.
How a semantic layer fixes it: With a semantic layer, the data team specifies metrics once in a central semantic model. The model captures the calculation rules how ROAS is computed, which dimension and metric combination is valid, what filters apply, which feeds go into each metric. Users then access those pre-built measures through self-service tools that query the semantic layer directly.
ROAS by channel takes 30 seconds instead of two weeks because the calculation already exists. The only remaining question is which visualization to use. New questions that combine existing dimensions and measures can be answered instantly. The team shifts from being a query-writing service to building infrastructure that scales.
The time savings compound: in organizations that have properly implemented a semantic layer, data teams report spending 60-70% less time on repetitive requests and more time on high-value modeling work.
Problem 3: The Dashboard Nobody Trusts
What it looks like: You have a beautiful dashboard with charts and graphs. It auto-refreshes every hour. Nobody actually looks at it. When decisions get made, people say “I do not trust that number” and pull their own figures from the source platform. Your business intelligence investment is wasted.
Why it happens: No governance over how metrics are calculated. Different people built different dashboards at different times with different assumptions. The numbers do not match each other, so none of them are trusted. When a user investigates, they find that two dashboards calculating “active users” use different interpretations of what “active” means. One counts any login. Another counts any meaningful action. The discrepancy is never resolved, so both get ignored.
Data quality issues compound the problem. Without documentation of how each metric was built, there is no way to audit whether a number is correct. When something looks wrong, nobody can trace it back to its source. The organization stops relying on governed figures and reverts to platform-native numbers exactly the fragmentation you were trying to solve.
How a semantic layer fixes it: The semantic layer is the single source of truth for metric specifications. Every dashboard, regardless of which BI tool built it, pulls from the same governed semantic model. When someone asks “how is this calculated?” there is a clear answer in the semantic layer description: the exact calculation rules, the feeds, the filters, the aggregation method.
Trust returns because the specifications are visible and consistent. Users can see that the conversion rate metric uses the same formula whether they are looking at Looker, Tableau, or a custom dashboard. Engineers can update a specification in one place and know it propagates correctly everywhere. Stakeholders stop debating numbers and start using them.
Data lineage becomes traceable. You can view exactly where each metric comes from, which tables feed it, and when it was last updated. Data governance becomes real rather than aspirational.
Beyond trust, a semantic layer also solves data access and security issues that most teams never explicitly address. Without centralized control, sensitive data revenue by customer, margin by SKU, individual user behavior is accessible to anyone who can write a SQL query. A well-designed semantic layer applies row level security, access control policies, and permission management at the model layer. Developers specify who can view which dimensions and measures. Technical users get full access. Non-technical colleagues get governed access to the data insights they need, without exposing enterprise data they should not see. This is metadata management done properly: one place to govern what data is accessible, to whom, and under what conditions.
Problem 4: The New Tool Integration Nightmare
What it looks like: You add TikTok Ads to your marketing mix. Now you need to rebuild ROAS calculations across four dashboards, two spreadsheets, your BI tool, and the AI analytics agent your team started using. Each one needs the new source integrated manually. The engineering work takes three weeks. By the time it is done, your TikTok campaigns are already three weeks old and you have been flying blind.
Why it happens: Calculation rules live inside each individual tool. When metric specifications are embedded in BI calculated fields, in SQL scattered across your cloud store, and in spreadsheet formulas, adding a new feed means finding and updating every location where those metrics are assembled. There is no central model to update.
This is the classic fragmentation pattern of the modern data stack. As organizations add more platforms, more cloud feeds, and more self-service tooling, the surface area for maintaining consistent metric definitions grows exponentially. What started as manageable complexity becomes an infrastructure problem that limits adoption of new technology.
How a semantic layer fixes it: The semantic layer sits between your feeds and your reporting stack. It is the translation layer: raw data comes in from your cloud store Snowflake, Databricks, BigQuery, or wherever your data lives and governed metrics go out to every connected system that queries the layer.
When you add TikTok Ads, you add the connector and specify the new dimension types and measures once in the semantic model. Every system that queries the semantic layer automatically has access to the new marketing data. No rebuilding. No hunting down SQL. No coordinating with five different teams.
This is what proper data infrastructure looks like: a semantic layer that abstracts away the complexity of the underlying database, so your team spends time building models rather than maintaining integrations. The same model that powers your BI dashboards also powers your AI agents, your API endpoints, and any future connectors you add to your stack.
How technical teams implement this: Most semantic layers are built using code-based YAML configuration files. Products like dbt (from dbt Labs) and Cube use YAML to specify semantic models dimensions, measures, joins, and filters in a format that is version-controlled, peer-reviewed, and deployable like any other software. A developer writes the YAML spec once, and the semantic layer compiles it into optimized SQL that runs against your database. This code-first approach is what makes the semantic layer a real data platform rather than a BI-layer configuration screen. Changes go through standard software development patterns: pull requests, code review, testing, and staged rollouts. Dbt Labs and Cube are the most widely adopted open-source vendors in this space, with large community ecosystems and enterprise support tiers. Choosing the right vendor matters: each has different performance characteristics, YAML schema conventions, and licensing models.
Problem 5: The AI Agent That Hallucinates Your Metrics
What it looks like: You ask your AI analytics product “what was our ROAS last month?” It gives you a number. Then you ask the same question differently “how did our return on ad spend look in March?” and get a different number. You ask your CFO and get a third number. The AI is confidently wrong, which is worse than being obviously wrong.
Why it happens: Generic AI agents have no context about your company. When an LLM is given access to your raw cloud store, it does not know your metric specifications. It does not know that your ROAS excludes branded keywords. It does not know that you treat “last month” as a complete calendar month rather than rolling 30 days. It writes SQL that looks correct but encodes different assumptions than your needs require.
The natural language interface makes the problem invisible. When an analyst writes SQL, you can review the query. When an AI agent writes SQL, most users never see it. The agent presents results in confident natural language, and the underlying query could be completely wrong for your use case. Performance issues are similarly invisible an LLM that generates inefficient SQL can bring a cloud store to its knees without anyone realizing the root cause.
How a semantic layer fixes it: AI agents connect to the semantic layer rather than directly to raw data. Instead of generating ad hoc SQL against your cloud store, the agent calls pre-built metrics with governed specifications. The semantic layer translates the question “what was our ROAS?” into the correct query using the calculation rules your team has specified and validated.
The result is AI that gives consistent, governed responses. The same metric used in your dashboards is the one the AI agent uses. Natural language queries map to semantic model concepts rather than to raw table structures. You get the accessibility of conversational BI without sacrificing the quality of your governed metrics.
This is the future of business intelligence: LLM-powered agents that are grounded in a semantic layer so they answer questions accurately rather than plausibly. Implementing a semantic layer is, in many ways, a prerequisite for reliable AI-driven reporting.
The Hidden Cost of These Five Problems
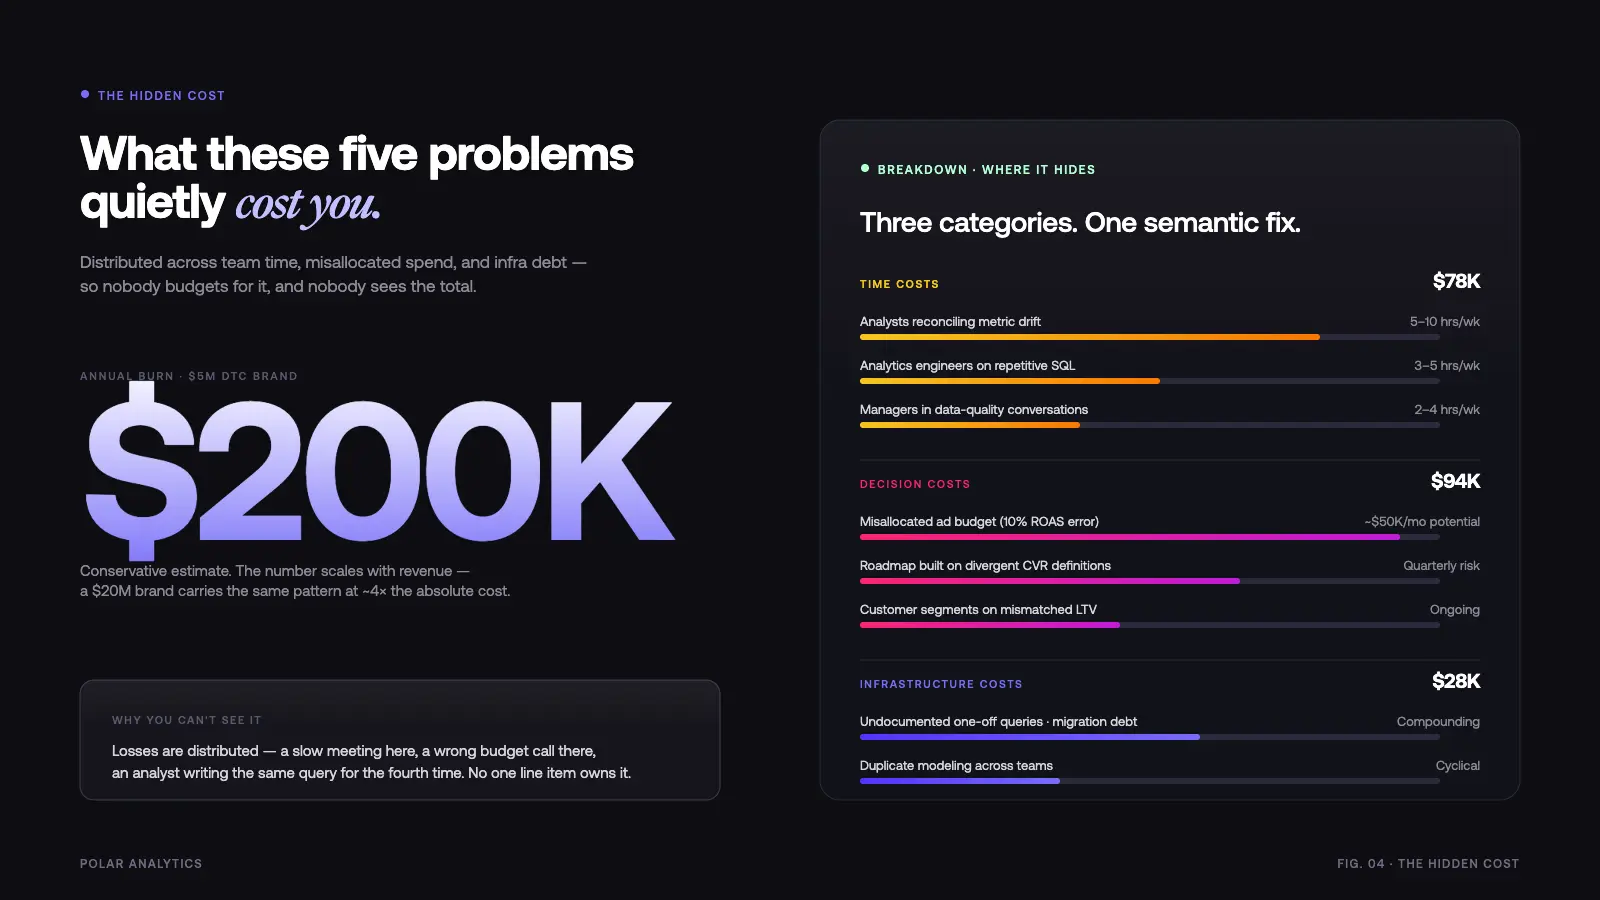
These issues are not just annoying. They are expensive. And most organizations have no way to measure the cost because the losses are distributed and invisible.
Time costs:
- 5-10 hours per week per analyst reconciling metric discrepancies
- 3-5 hours per week per analytics engineer on repetitive SQL requests
- Hours per week per manager in stakeholder conversations about data quality
Decision costs:
- Marketing budgets allocated based on incorrect ROAS a 10% ROAS misread on a $500K monthly ad budget is $50K misallocated per month
- Product roadmaps prioritized based on conversion rate figures that use different definitions in different dashboards
- Customer segments built on LTV calculations that differ across company units
Infrastructure costs:
- Technical debt from hundreds of one-off queries with no documentation
- Multiple teams solving the same data modeling problems independently
- Migration costs when you try to consolidate to a new BI tool and discover your metrics were never properly centralized
For a DTC brand at $5M revenue, these issues conservatively cost $200,000 per year in wasted spend, missed opportunities, and team time. For a $20M brand, the cost scales proportionally and the organizational complexity makes the problems harder to resolve without a proper semantic layer.
What a Proper Semantic Layer Looks Like in Practice
A well-implemented semantic layer addresses all five problems through the same mechanism: centralized calculation rules that govern how raw data is translated into metrics.
The semantic model defines your dimensions and measures in a format your entire stack can consume. Dimensions describe your data: channels, products, time periods, customer segments. Measures specify how you aggregate that data: ROAS, LTV, CAC, AOV, contribution margin. The sum and average calculations, date filters, attribution windows, and exclusion rules live in the model not in individual SQL. You can think of semantic layers as a universal contract between the people who build data models and the people who consume data insights.
The data management layer documents those specifications and makes them accessible. Users can look up what any metric means. Engineers can see the lineage from cloud store table to dashboard number. When a specification needs to change, it changes in one place with version control. This is what real metadata management looks like not a data catalog that nobody updates, but a living model that stays in sync because it is the authoritative resource developers query through.
The query layer translates questions into optimized SQL against your database. Whether the request comes from a BI system, an AI agent, an API call, or a natural language query, the semantic layer routes it through the same governed specifications and returns consistent results. Performance is predictable because the query patterns are known and optimized at the model layer.
The integration layer connects your feeds Snowflake, Databricks, BigQuery, your cloud store to the semantic model without requiring you to rebuild the model every time your data infrastructure changes. A standard API makes semantic layers universally accessible to downstream systems without vendor lock-in.
How Polar Analytics Solves These Problems for Ecommerce
Polar Analytics built a managed semantic layer specifically for DTC and ecommerce teams pre-loaded with the definitions that matter (ROAS, LTV, CAC, AOV, contribution margin, new vs. returning customer, channel-level attribution) and connected out-of-the-box to 45+ sources: Shopify, Meta, Google, TikTok, Klaviyo, Recharge, Stripe, Amazon, and the rest of the stack. Each metric is specified once in the semantic model; every dashboard, custom report and AI query on top of the platform pulls from that same source of truth. No warehouse to provision, no dbt project to maintain the whole stack is managed for you and implementation is measured in hours rather than quarters.
That grounding is also what makes Polar’s AI layer reliable rather than hallucinated. Ask Polar, the built-in AI Data Analyst, answers natural-language questions by calling governed metric definitions not by writing ad hoc SQL against raw tables. Polar MCP extends the same discipline outside the product: you can plug Claude, ChatGPT or Cursor directly into your Polar semantic layer so your own AI tools query the exact same certified data your analysts and dashboards use. Data teams keep ownership of the logic, everyone else gets self-service access to consistent numbers, and reconciliation meetings stop happening because there is only one set of numbers left to debate.
Conclusion
These five issues hide in every ecommerce organization that uses more than one analytics tool. They feel normal because everyone has them. The data reconciliation meeting is just “how things work.” The two-week report delay is just “the team backlog.” The dashboard nobody trusts is just “you have to know which one to look at.”
They are not normal. They are symptoms of missing semantic layers a centralized place where your calculation rules live, your data definitions are governed, and your metrics are served consistently to every tool in your stack.
The fix is a semantic model that your entire company can rely on: specify your rules once, document them properly, and serve them everywhere. Your team stops being a query-writing bottleneck and starts building data infrastructure that scales. Users get consistent answers to complex questions without needing developer skills. Your AI agents ground their responses in governed data rather than guessing at SQL.
The key to real time data insights at scale is not more tools it is one semantic layer that all your tools rely on.
Frequently Asked Questions
See how Polar eliminates these problems for ecommerce brands. Book a demo and experience what a proper semantic layer delivers.
Table of contents
Frequently asked questions