Inside Polar’s Advanced and Flexible BI for Ecommerce Brands
TL;DR
Most ecommerce tools offer beautiful dashboards. Some even have server-side pixels or attribution models.
But beneath the surface, most are missing something critical: An understanding of how ecommerce businesses operate.
Metrics are inconsistent across teams. Attribution is misaligned. Data lives in silos, and requires heavy analysis to extract insights. The result? Missed signals, delayed decisions, and wasted spend.
Polar solves this with a unified, ecommerce-native BI (Business Intelligence) layer that works out-of-the-box. It’s not retrofitted from generic dashboards. It’s built with ecommerce operators in mind, from Shopify orders and cohort-based LTV to SKU-level profitability.
For brands trying to move fast, cut costs, or report with confidence, a data foundation makes all the difference. Here’s how it works and why it powers everything else.
A Semantic Layer Built for Ecommerce
At the heart of Polar’s BI engine is the Semantic Layer. It’s a fully mapped ecommerce ontology that standardizes your entire data stack across channels, platforms, and stores.
Instead of manually wrangling messy CSV exports from Google Ads, Meta, Shopify, and TikTok, the semantic layer does the cleanup for you. It reconciles naming conventions, normalizes time zones and currencies, and aligns data structures behind the scenes.
The result is consistency. Every team, from finance to growth, operates under the same definitions, regardless of the source.
The Semantic Layer powers:
- Out-of-the-box metrics like LTV, Contribution Margin, and MER.
- Trustworthy natural language queries that auto-translate to SQL.
- Consistent definitions across dashboards and teams.
This central logic eliminates friction and unlocks self-serve clarity from day one.
Going Beyond Static Dashboards
Dashboards are useful, but they’re only one layer of BI. Polar’s Business Intelligence includes a full suite of tools designed to give ecommerce operators hands-on access to flexible, dynamic insights, whether they use SQL or not.
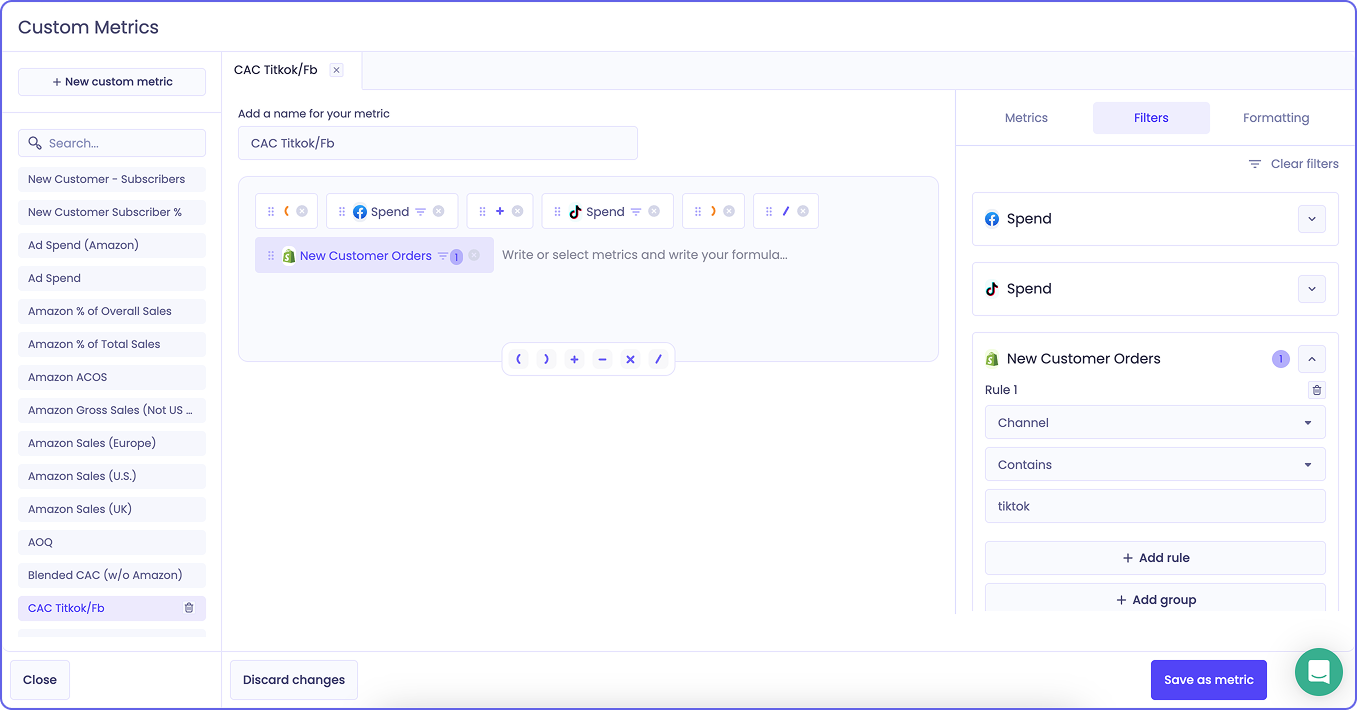
Custom Metrics and Dimensions
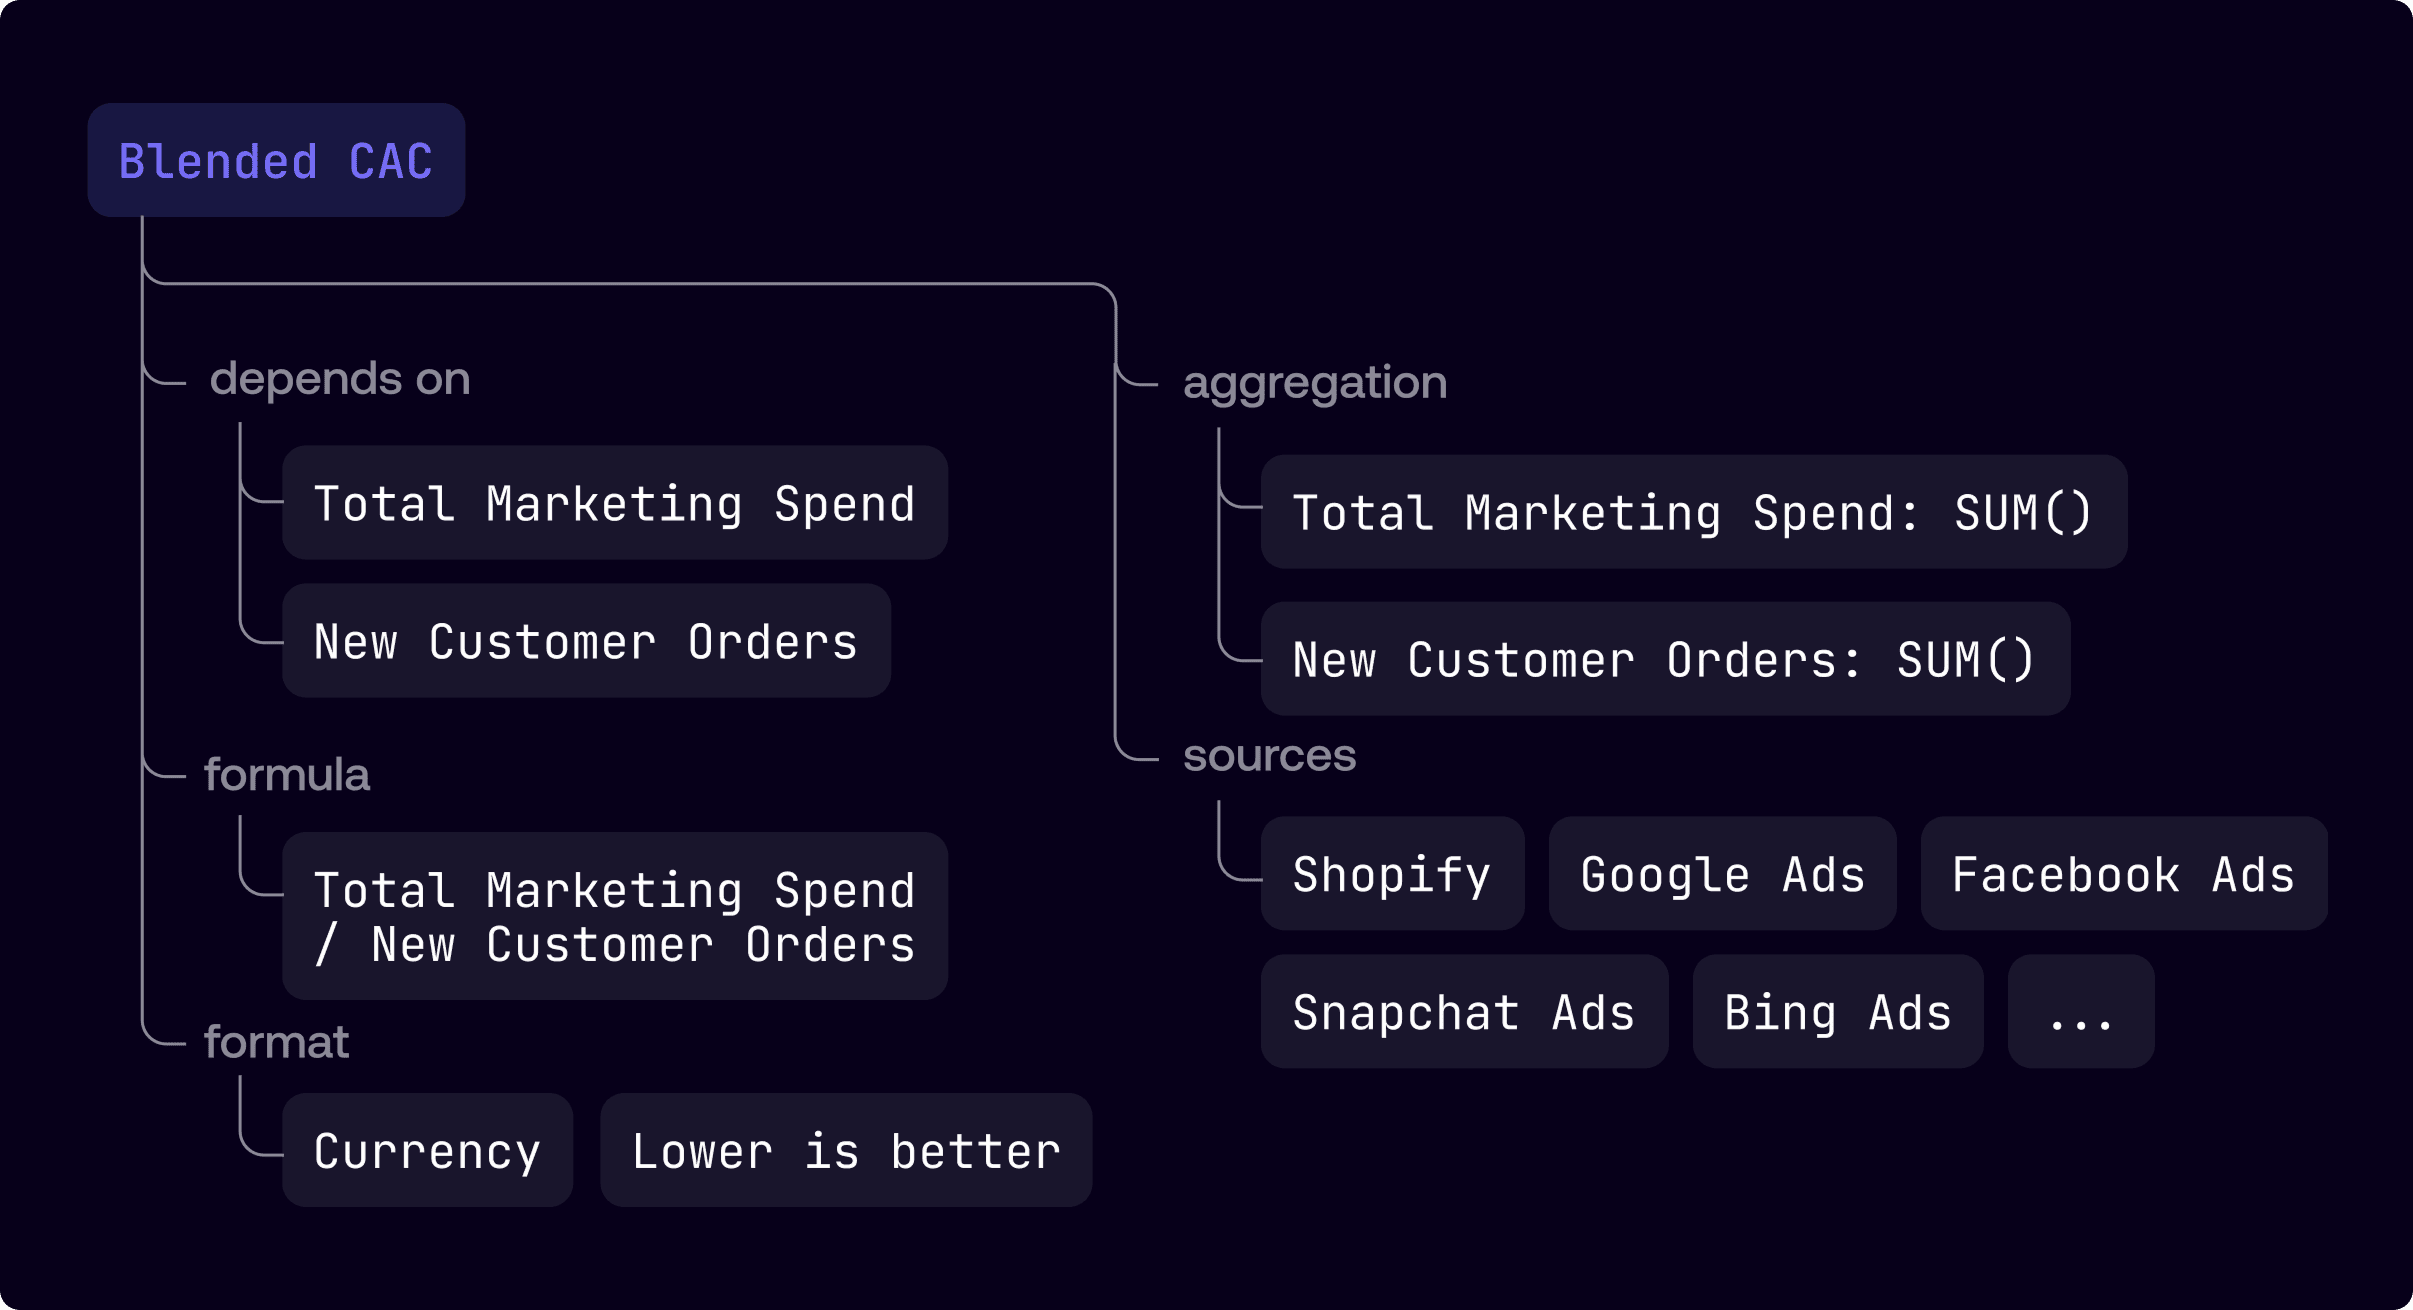
Operators can define advanced metrics “Gross Margin after Shipping,” “Blended CAC without Amazon,” or “Returning Customers by U.S.,” using a visual builder. Select the fields, add a calculation, and the new metric becomes available everywhere in the platform.
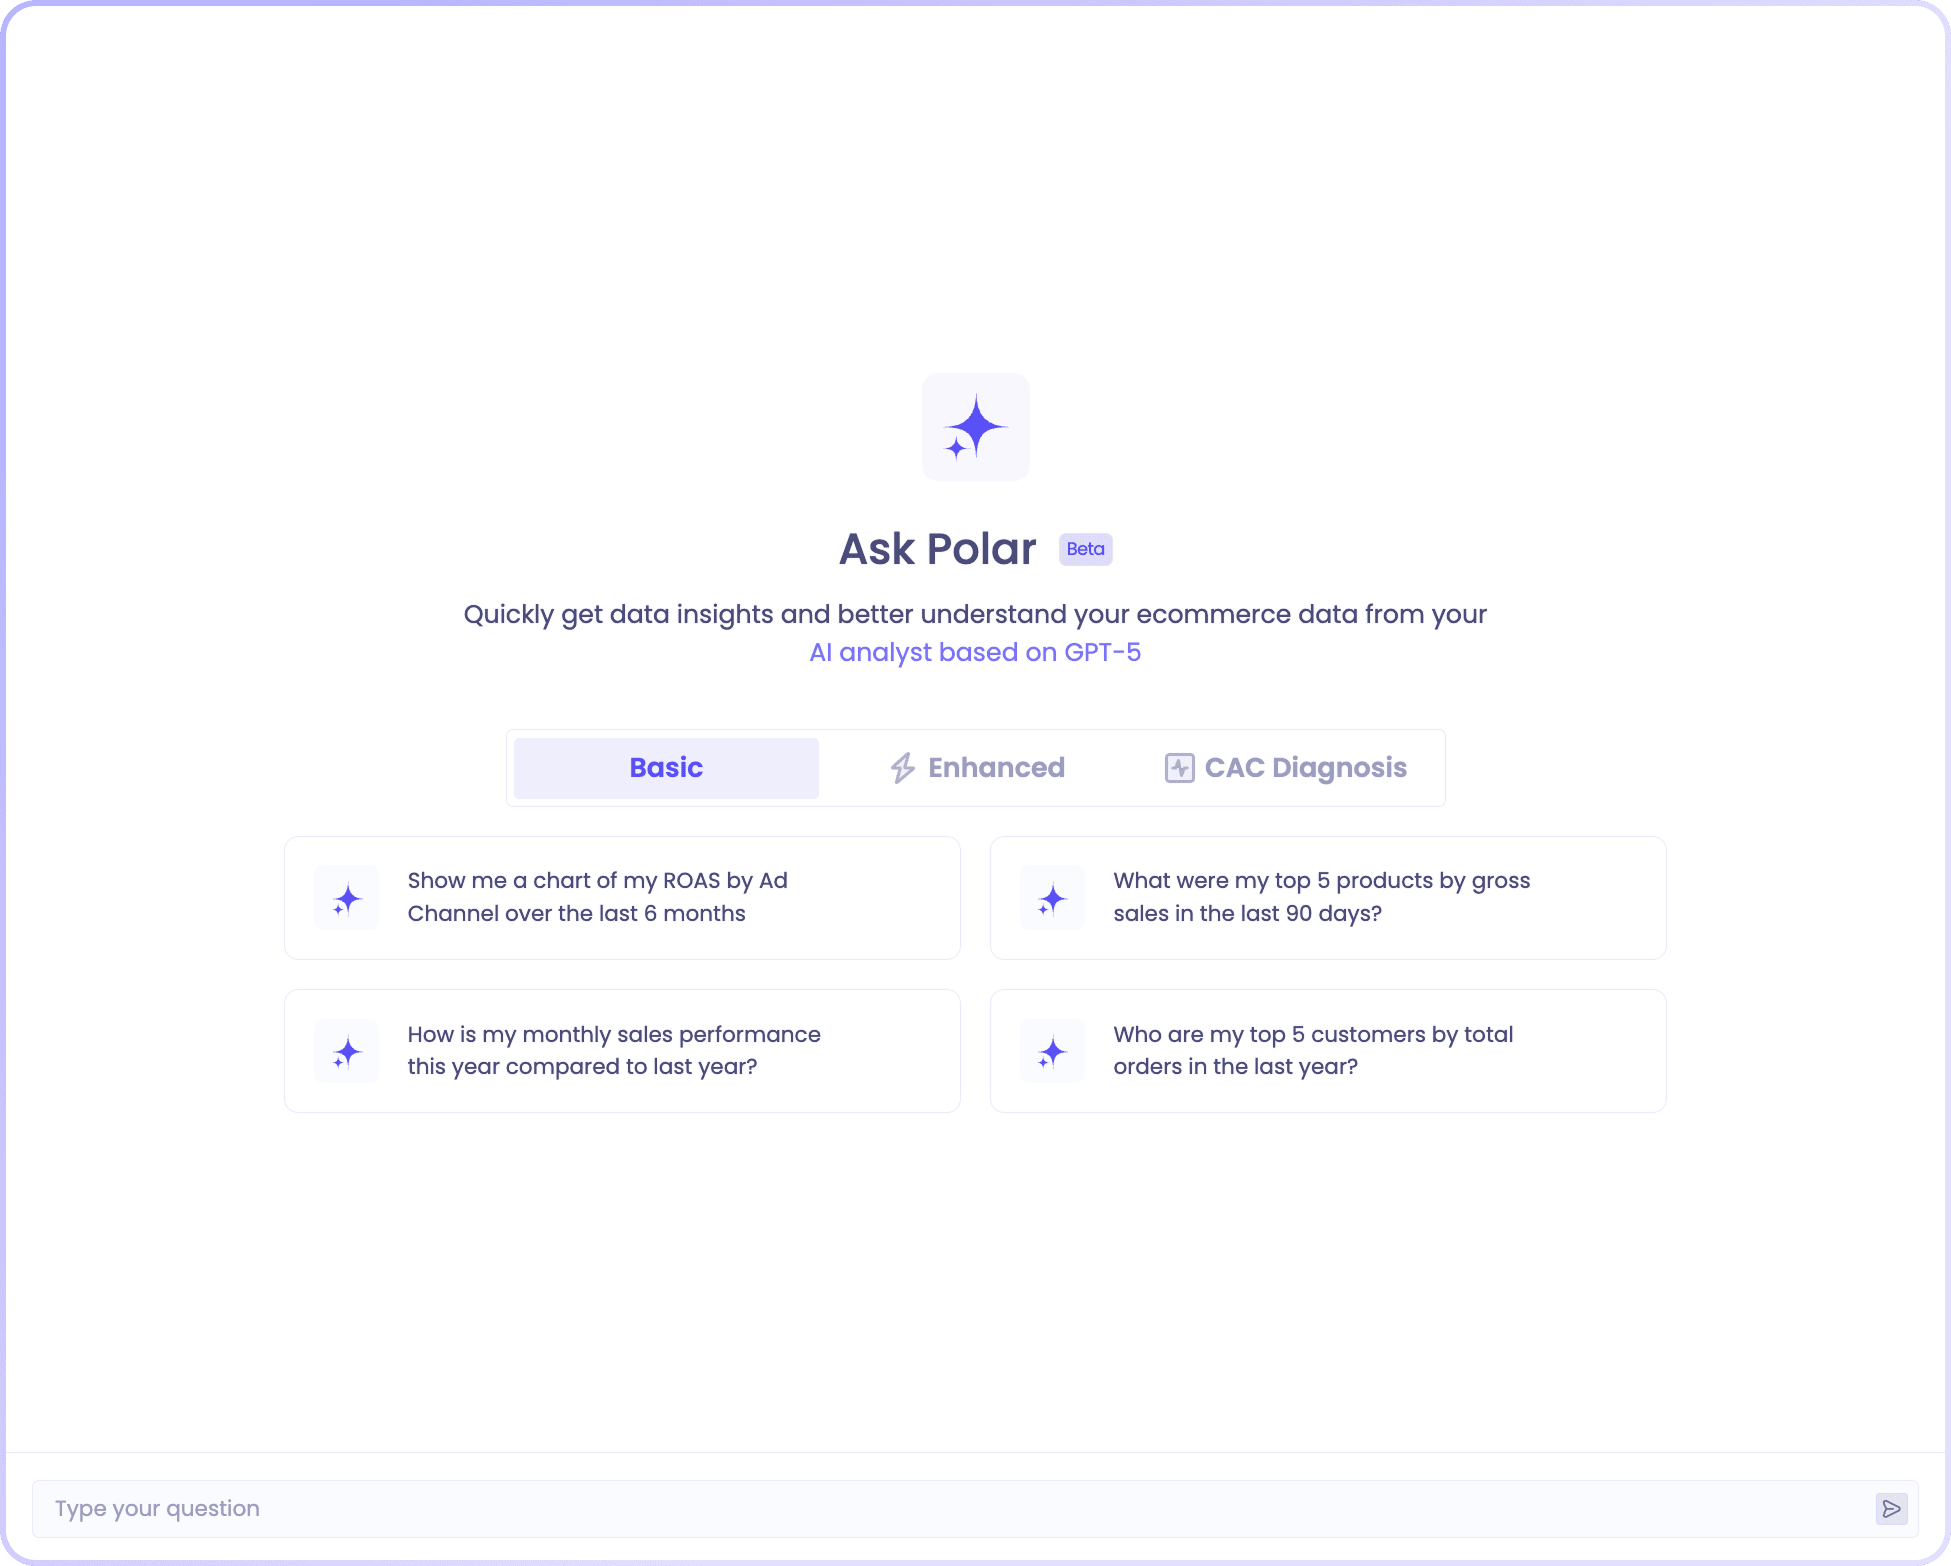
Ask Polar (Natural Language BI)
“Which channels brought in the most new customers last month?” or “Did paid search outperform Meta in Q1?”
Ask Polar turns questions like these into an accurate analysis. It combines leading LLMs with the semantic layer to surface business context. There are two modes:
- Basic mode: Retrieves and visualizes relevant data quickly
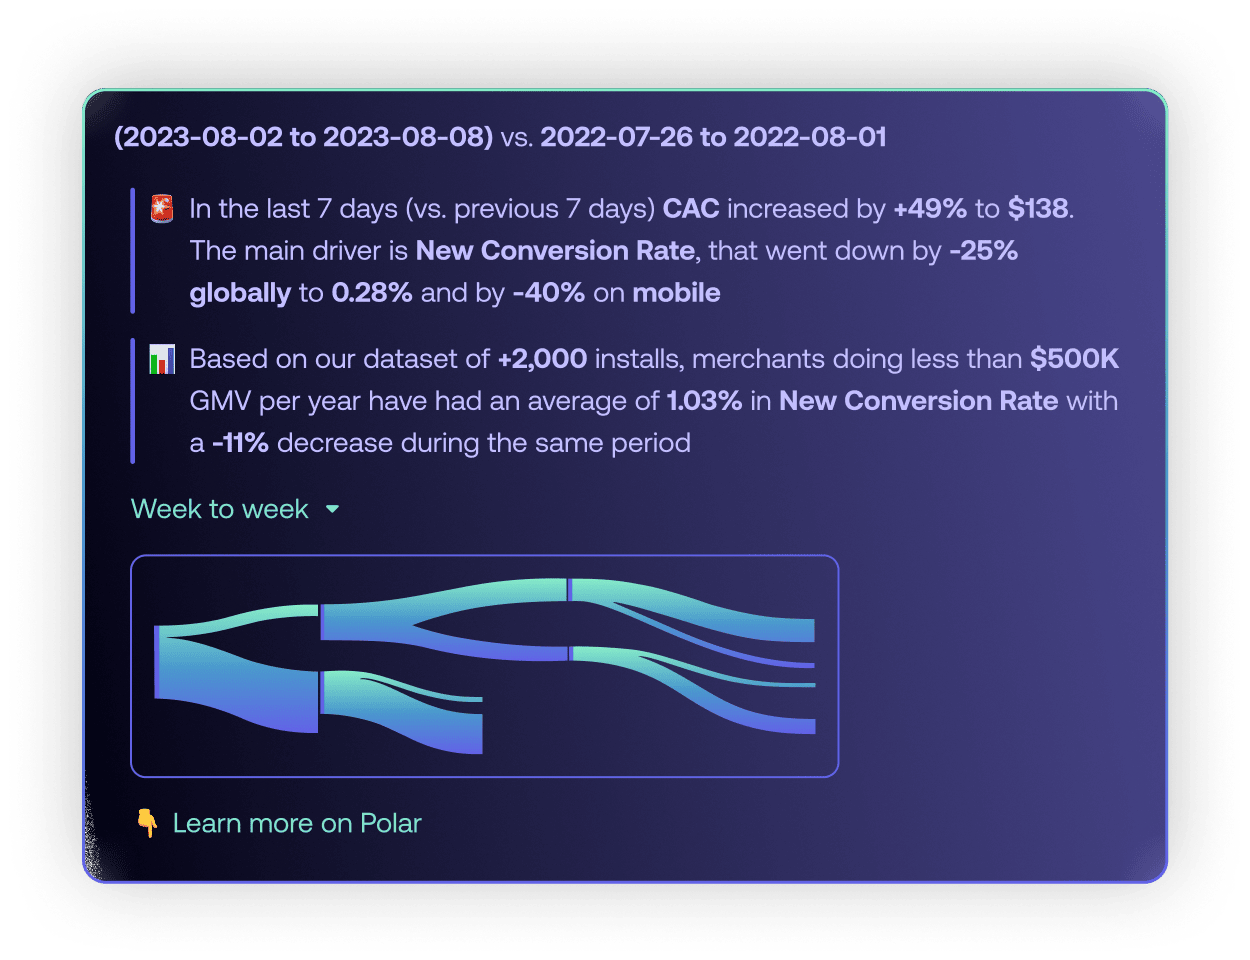
- Enhanced mode: Adds interpretation and pattern recognition.
This makes insights accessible across the organization, enabling operators and executives to explore insights without requiring SQL.
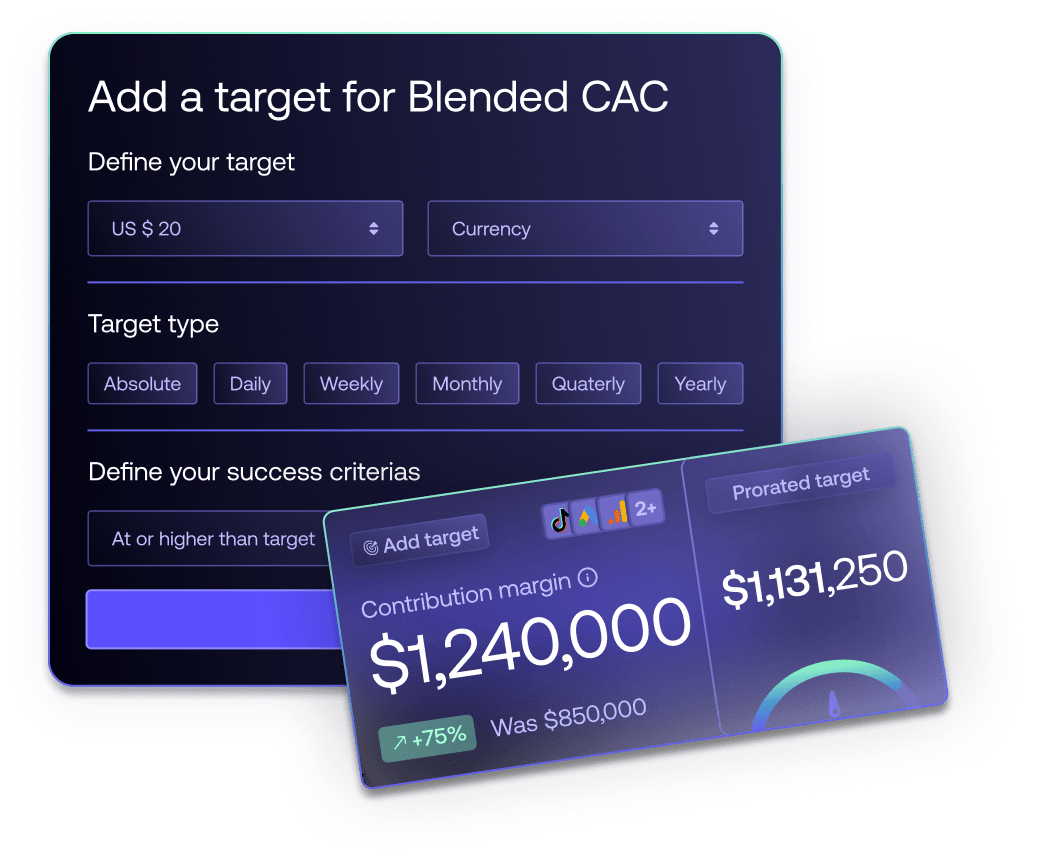
Goals, Alerts, and Reporting Automation
Teams can set goals for CAC, ROAS, revenue, and other metrics, then track progress directly within dashboards.
Alerts notify when CAC, revenue, bounce rate, or conversion drops beyond a defined threshold.
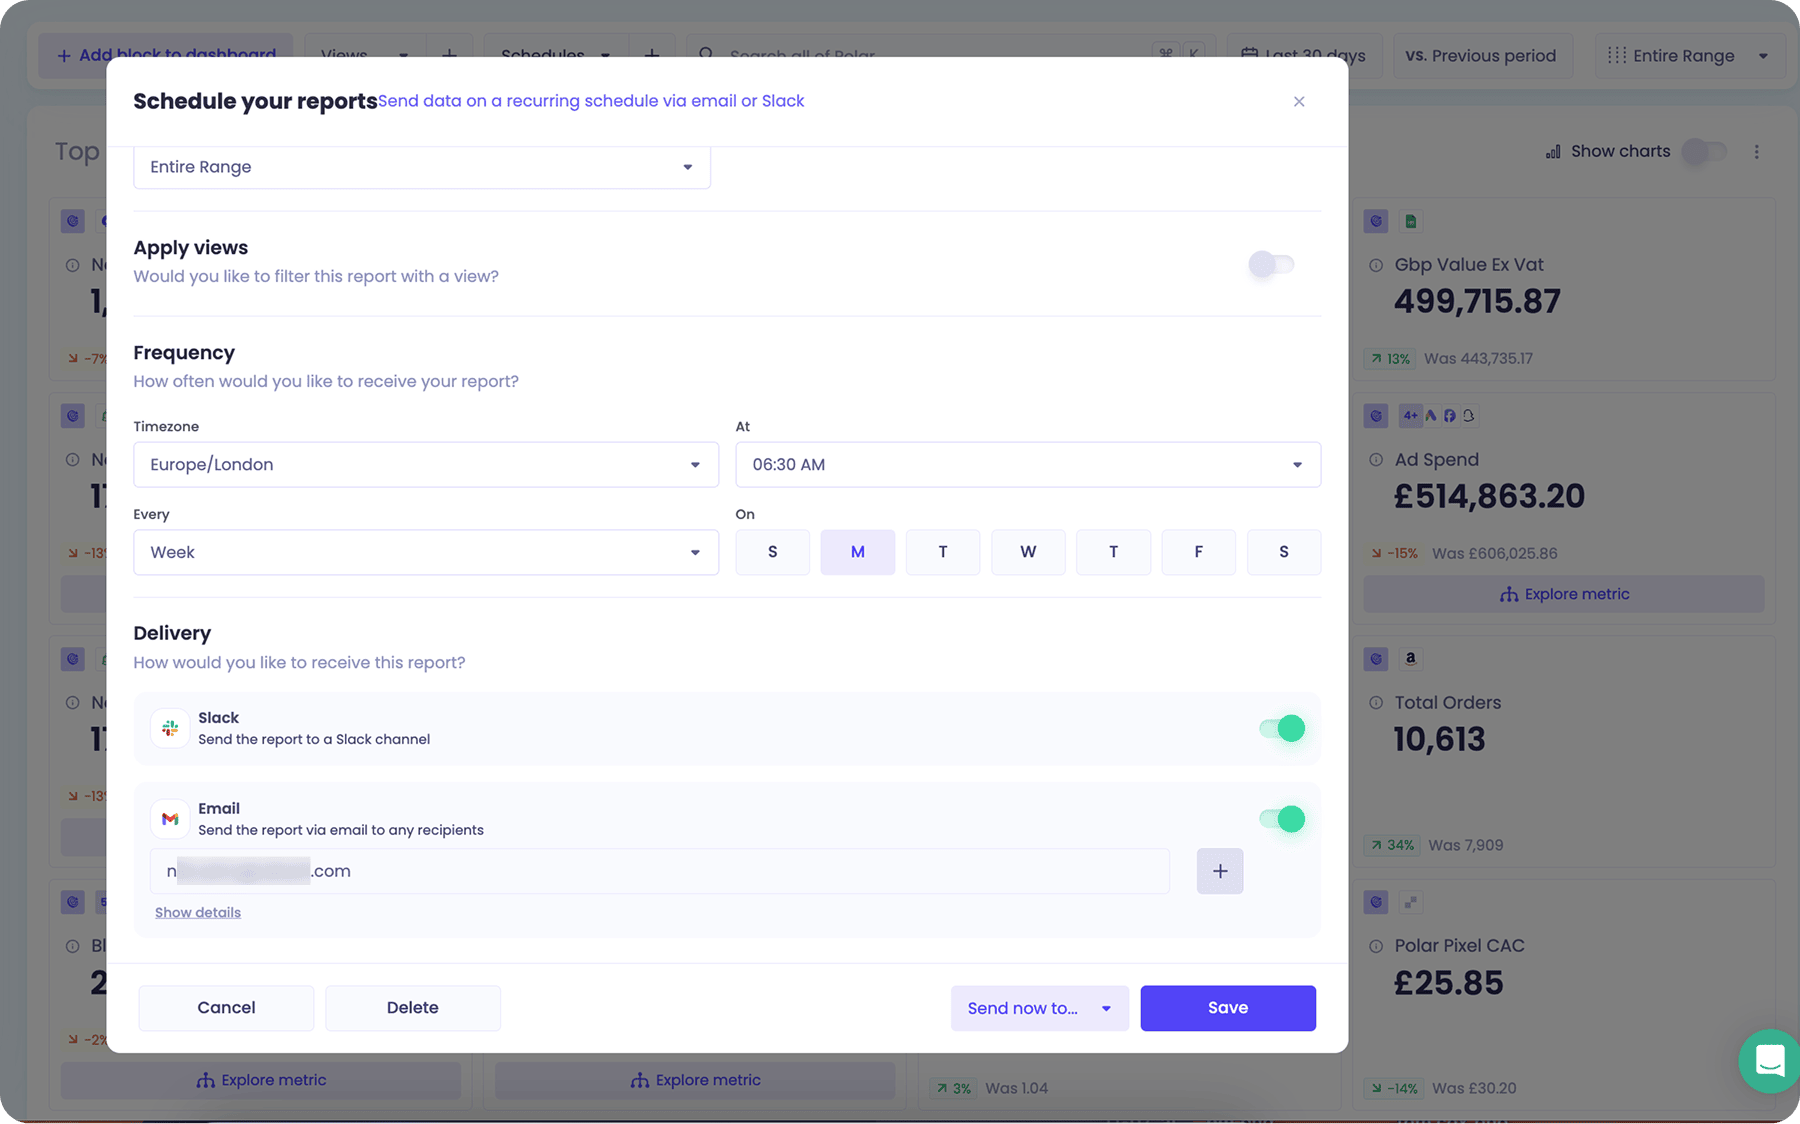
Scheduled reports deliver curated insights to Slack, email, or shared dashboards, saving time for brands and agencies managing multiple accounts.
Custom roles and permissions let you grant access by role, and report without revealing data you would rather keep private. Share board-ready metrics without exposing day-to-day details, or limit agencies to the campaigns they manage.

Paid Marketing and Merchandising
Polar BI tools also focus on mapping relationships and uncovering friction in the customer journey.
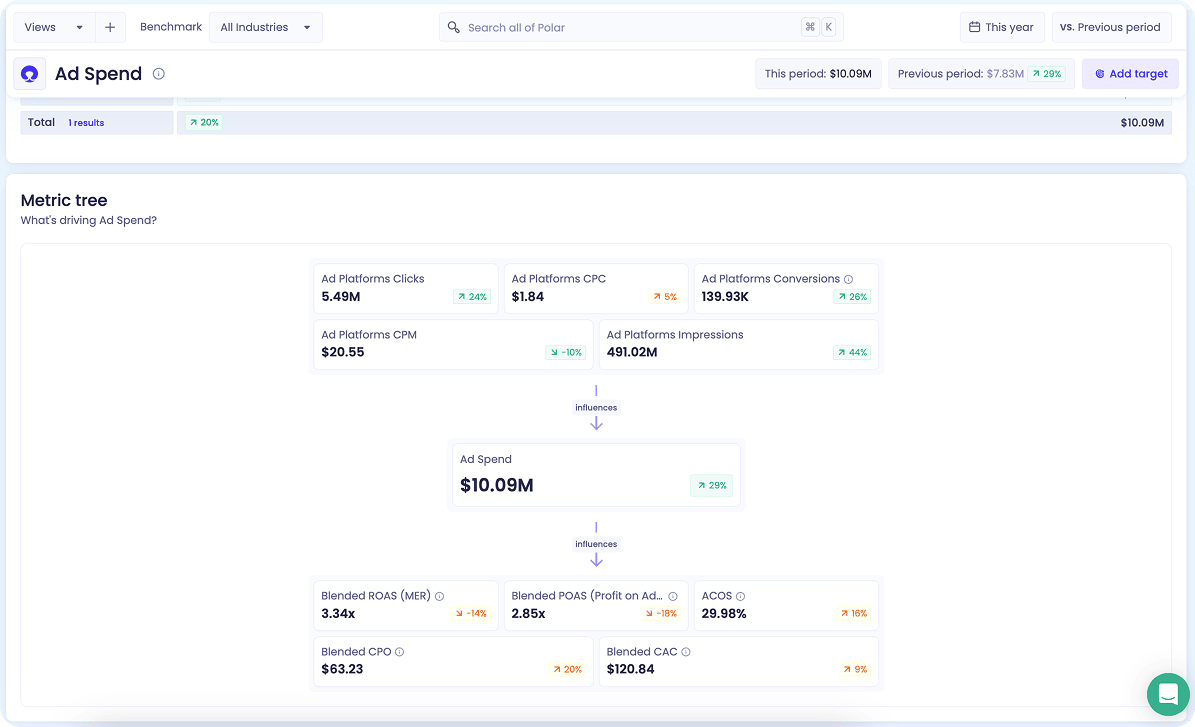
Metric Tree
Click any KPI, such as Ad Spend, and reveal how upstream or downstream metrics influence performance. Find the root cause behind spikes, drops, or unexpected shifts.
- Click on “Ad Spend” to see how campaign → clicks → orders → net profit connect.
- Spot how CTR, Sessions, and Conversion Rate shift by region.
- Trace unexpected drops in performance back to changes in spend or traffic.
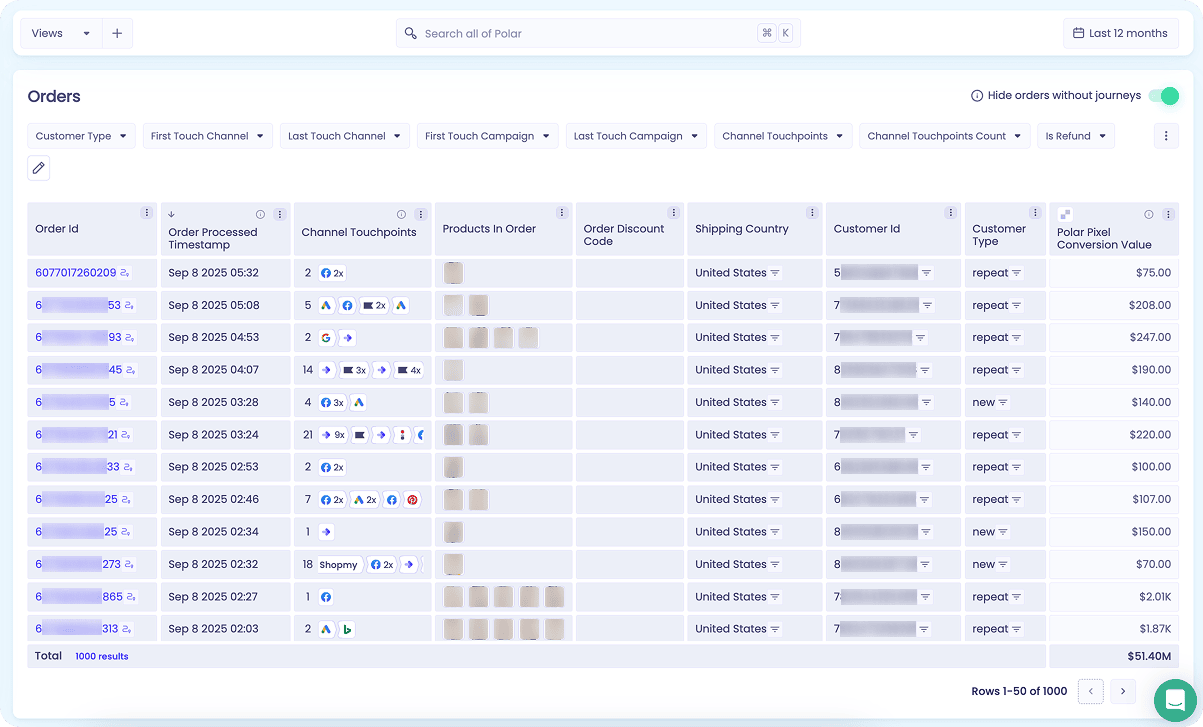
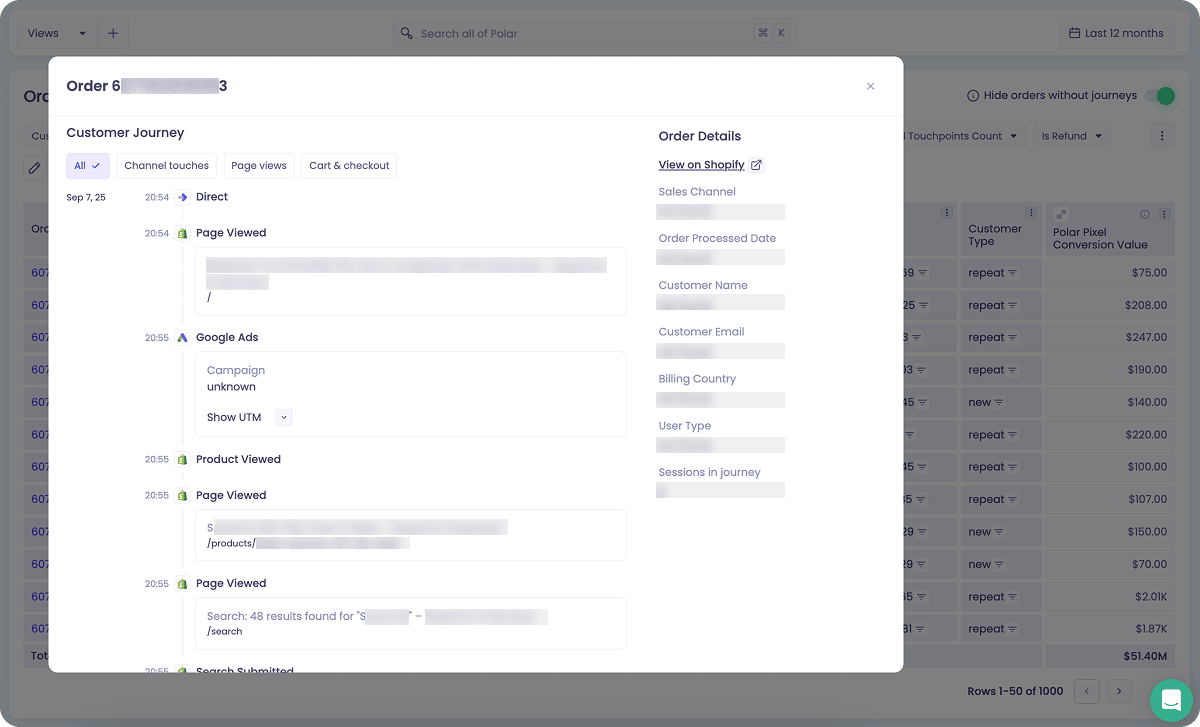
Order Journeys
Order Journeys visualize every touchpoint along the customer journey, from first session to final conversion:
- Filter by campaign, channel, or user type.
- Spot drop-off points in the funnel.
- Identify opportunities for retargeting or creative optimization.
Flexible and Realistic Tracking
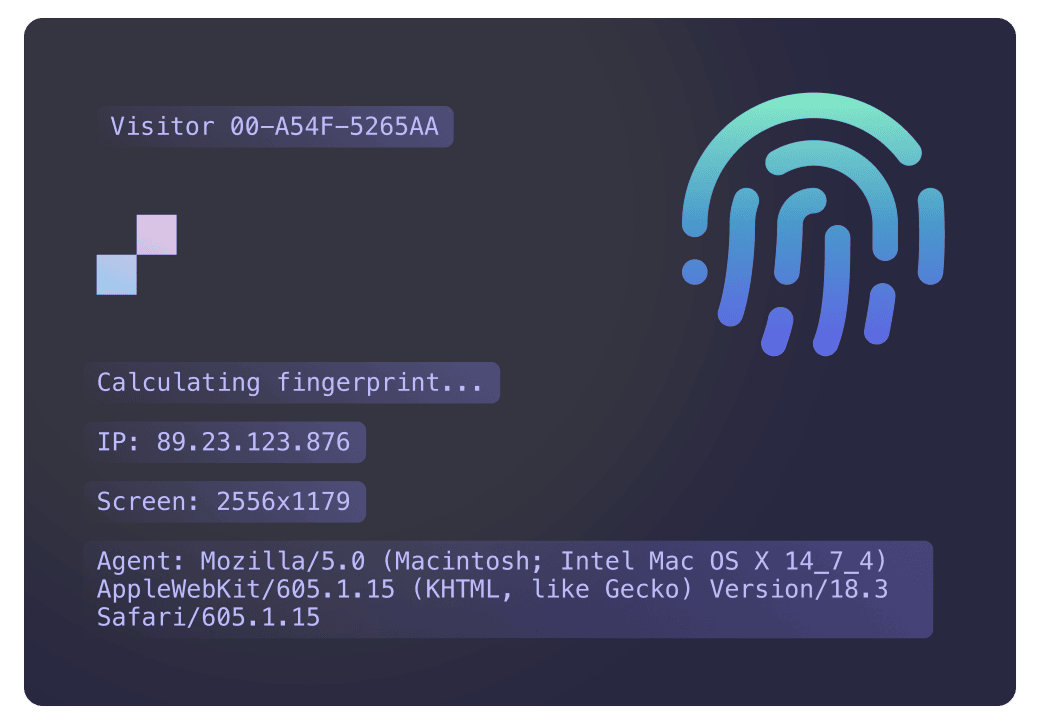
Lifetime ID and Pixel Tracking
Polar uses a graph-based system to unify customer identifiers into a single Lifetime ID. Signals like local storage and IP address are converted into nodes, with event-level connections forming the edges.
This stitching allows:
- High-resolution customer journey tracking.
- Accurate revenue attribution even across devices and sessions.
- Reliable pixel tracking post-iOS 14 and similar updates.
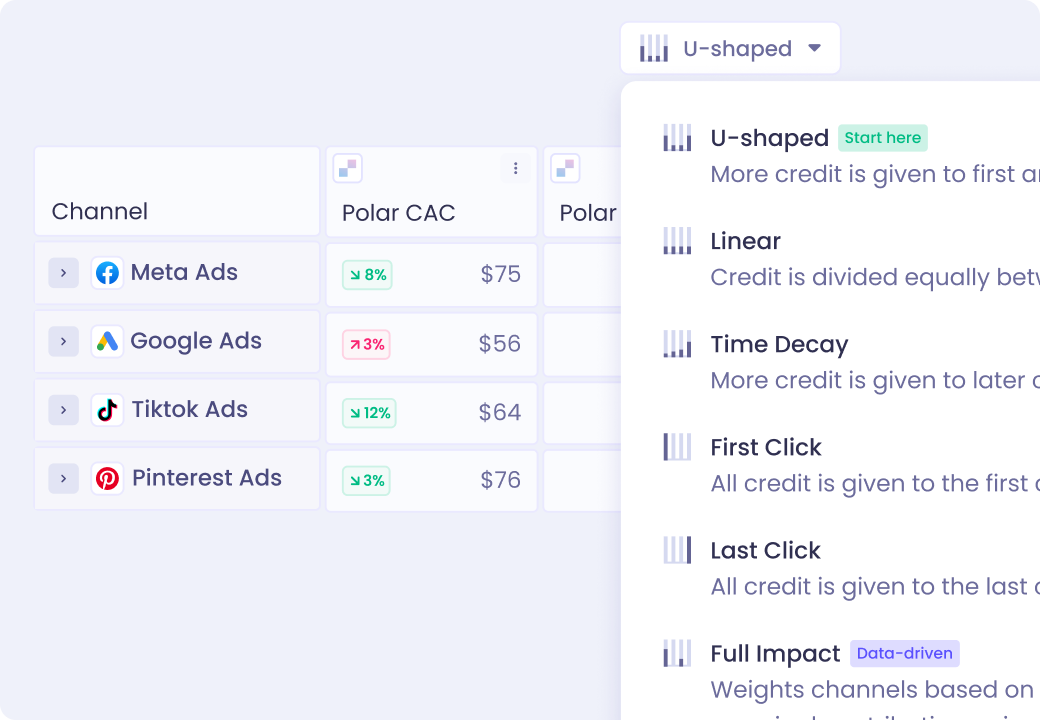
Attribution Models
Attribution isn’t one-size-fits-all. Polar supports 10+ different models to reflect measuring acquisition efficiency and budget optimization:
- First Click, Last Click, Linear, U-shaped, and Time Decay.
- Paid-only models like Paid Linear, Full Paid Overlap, and Full Paid Overlap + Facebook Views.
- Full Impact and Full Impact Paid.
The attribution engine is powered by the Polar Pixel, a first-party tracker that captures accurate event data and supports server-side integrations (such as CAPI) to minimize data loss due to cookie or browser limitations.
Integrations
SQL Access and Your Own Data Warehouse
Some questions require going beyond dashboards. That’s why technical teams can access a dedicated Data Warehouse connected to Polar’s BI infrastructure.
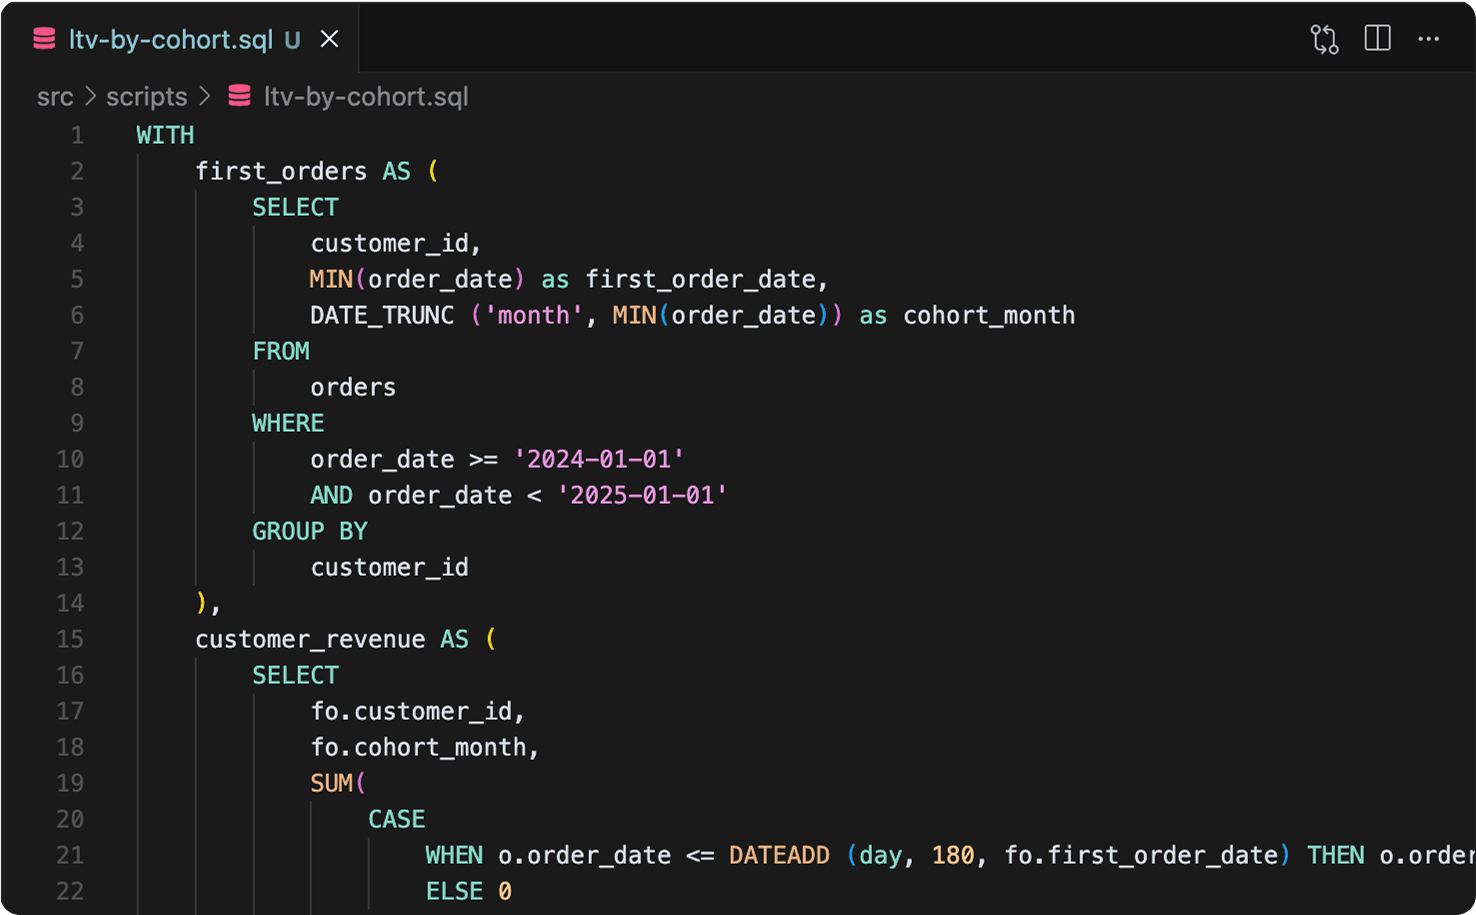
For data-savvy users, this means:
- Running SQL queries on ecommerce-ready data.
- Exporting to external BI tools or building data models on top of Polar’s warehouse.
- Validating or extending metrics to fit evolving needs.
The Data Warehouse runs on high-performance infrastructure, with elastic scaling and no manual maintenance required.
Analysts get full transparency. Operators stay in control. Brands stop relying on partial answers.
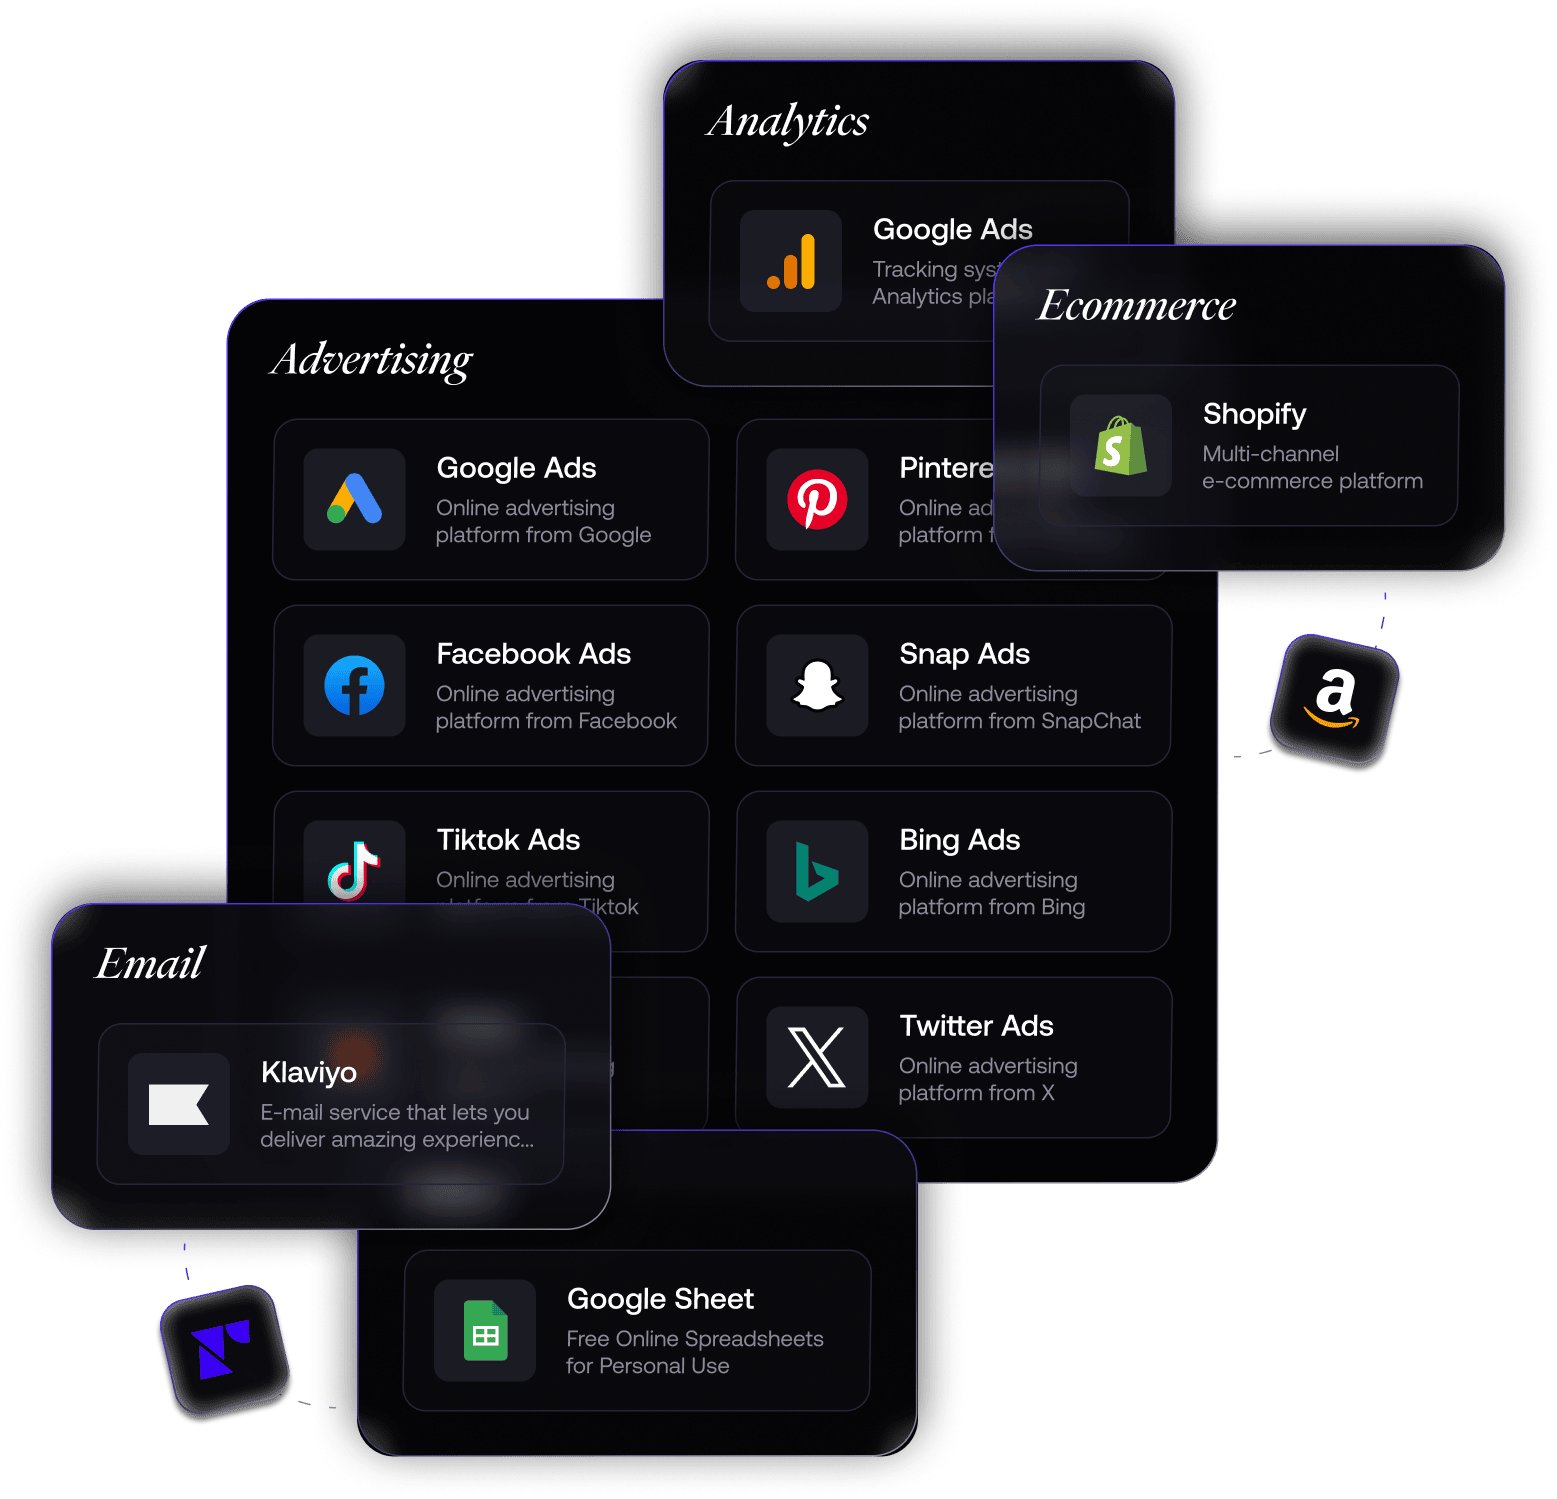
Platform Connectors
Polar supports 45+ native integrations, including Shopify, Amazon, Klaviyo, Meta, TikTok, Google Ads, Google Analytics, and more.
Sheets Mirroring and Custom Connectors
Polar supports live refreshes to Google Sheets, along with custom connectors for specific use cases. While not central to the BI experience, these tools add flexibility for advanced workflows.
These enable fast onboarding. Once connected, BI features work instantly without additional setup.
Built for Fast, Confident Decision-Making
Polar’s Business Intelligence is designed to eliminate friction between data and action. That’s why ecommerce teams using it often see:
- Faster campaign optimizations with daily alerts and metric decoding.
- Clearer channel insights via attribution models tied to actual first-party data.
- Higher profitability by tracking true contribution margins and custom KPIs.
- More confident reporting across stakeholders with consistent, trusted numbers.
Operators don’t need another dashboard. They need a system they can trust to keep pace with their brand. Polar BI makes that possible from day-to-day optimizations to long-term growth bets. That’s the promise of Polar BI, a foundation built to scale with you.
Table of contents
Frequently asked questions