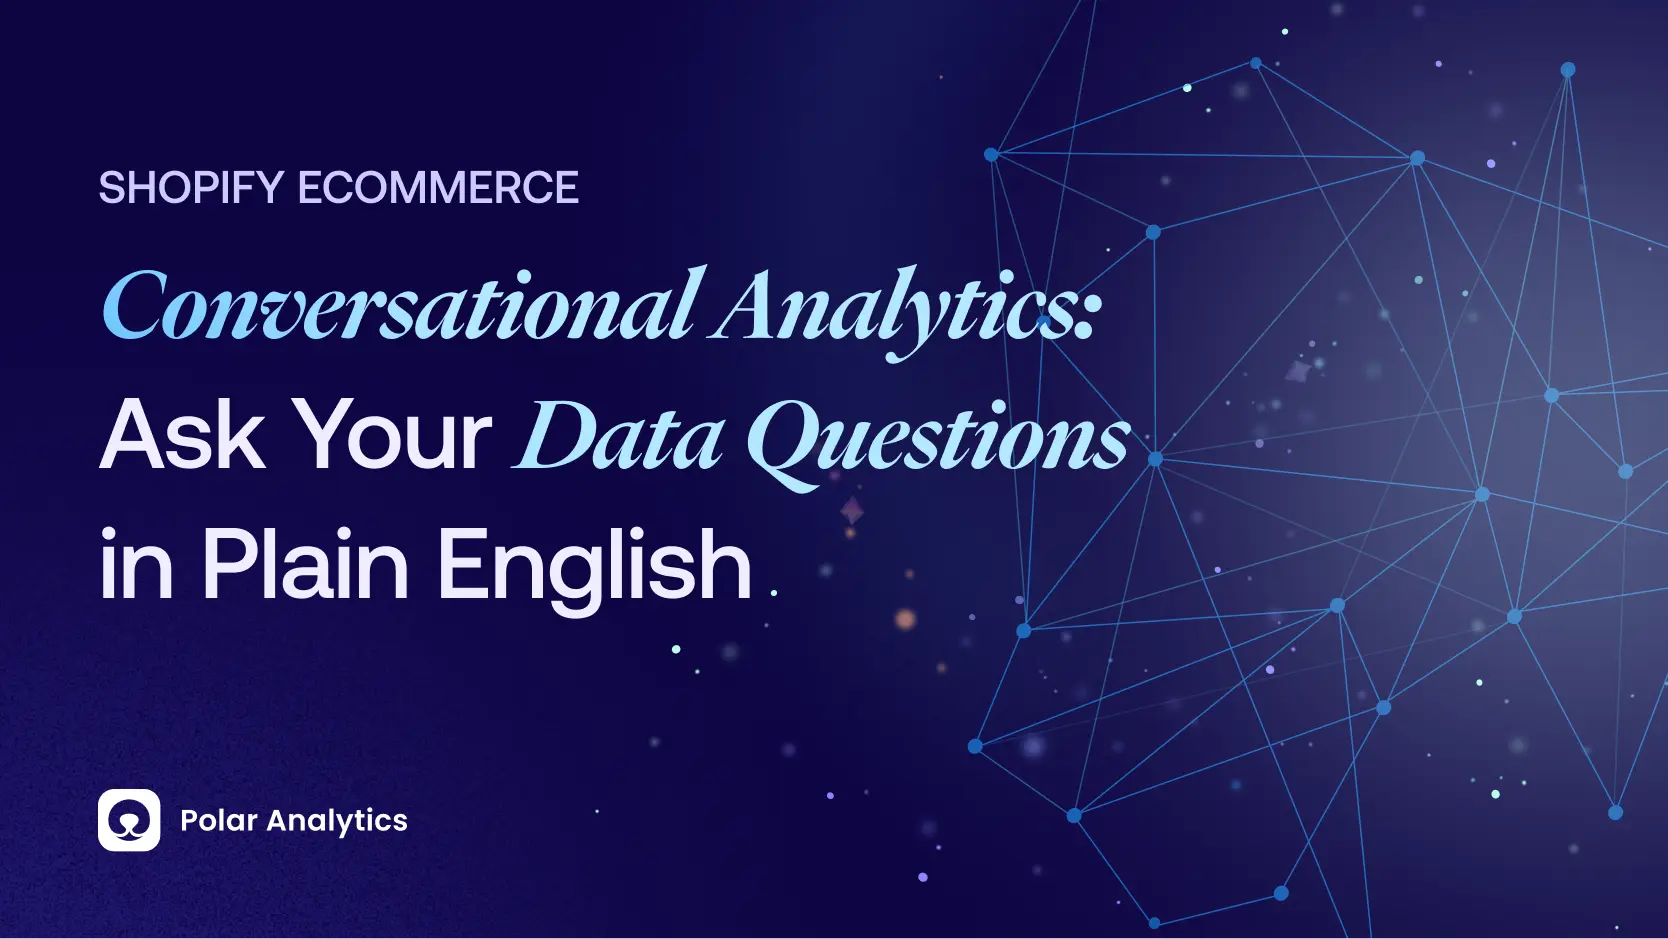
Conversational Analytics: Ask Your Data Questions in Plain English
TL;DR
- Conversational analytics lets you ask a business question in plain English ("what was my blended ROAS by channel last week?") and get a governed answer back in seconds, no SQL, no report-building, no analyst queue. It's the "ask your data" front door to BI, not the call-center transcript kind.
- The catch nobody mentions: the answer is only as good as the metric definition behind it. A chat box on unmodeled data invents definitions on the fly, so the same question returns three different numbers in a week. The fix is a governed semantic layer that gives the model one definition to query against instead of writing text-to-SQL and hoping.
- That semantic layer is exactly what Polar ships. Ask Polar reasons against Synthesizer (400+ governed commerce metrics plus custom ones), never writes text-to-SQL against raw tables, and every answer carries citations and a Data Debug Sheet so you can trace each number to its source query, backed by a dedicated Snowflake instance you own, first-party Polar Pixel attribution, and Causal Lift incrementality.
Conversational analytics is software that lets you ask data questions in plain English and get a governed answer back: a number, a chart, or a short explanation. This is the data analytics meaning of the term, the "ask your data" use case, not the call-center kind that mines support transcripts for sentiment. If you landed here looking for voice or agent QA tooling, this is the wrong page. If you run an ecommerce brand and you want to type "what was my blended ROAS by channel last week" instead of waiting on an analyst, keep reading.
Here is the thesis. By 2028 the dashboard is a debug tool, not a product. The question box is the product. But there is a catch nobody mentions, and it decides whether the whole category is useful or dangerous: the answer is only as good as the metric definition behind it. By the end of this guide you will know what conversational analytics actually is, where it breaks, and how to tell a real one from a chat box bolted onto a stale dashboard.
You type: "What was my blended ROAS by channel last week?"
Polar answers: Blended ROAS last week: 3.2x Meta 2.4x · Google 4.1x · TikTok 1.9x · Email 11.6x (mini bar chart)
Metric used: Blended ROAS = total revenue / total ad spend across all connected channels. Click to open the Data Debug Sheet and trace every number to its source query.
What is conversational analytics?
Conversational analytics lets a person ask a business question in everyday language and get a trustworthy answer without writing SQL, building a report, or pinging an analyst. You type a question. The software interprets it, queries your data, and returns a result you can read in seconds.
That is the data and business intelligence meaning of the term. It belongs to the same family as natural language query (NLQ), self-service analytics, and data democratization. It is a new front door to business intelligence, powered by large language models and generative AI.
One quick disambiguation so search engines and humans agree on what this page is about. There is a separate, unrelated use of "conversational analytics" in the contact-center world, where it means mining call and chat transcripts. That is a different namespace. We never touch it again after this sentence.
Conversational analytics matters because it collapses the distance between a question and a decision. The old path was: have a question, file a request, wait for an analyst, get a chart, realize it answered the wrong question, repeat. The new path is: ask, read, act. To go deeper on the natural-language layer that makes this possible, see how Polar lets you ask your data in plain English.
How conversational analytics works
Conversational analytics works in four layers. Most vendors only talk about the first and the last, which is exactly why so many tools disappoint.
The four layers
1. Natural language understanding. The model reads your question and figures out intent. "How did we do on Meta last month" has to resolve into a metric, a channel, and a date range.
2. Query generation. The system turns that intent into a data query. Many tools do this with text-to-SQL, where the model writes raw SQL against your tables and hopes the column names mean what it guesses.
3. The semantic layer, also called the metric layer. This is the part nobody talks about and the part that decides if the answer is right. The semantic layer holds the agreed definitions: what "new customer ROAS" means, which spend counts, how revenue is attributed. A KPI is a definition, not a number.
4. The answer surface. The chart, the figure, the sentence you read.
Here is the honest version of how this breaks. A chat box on unmodeled data has to invent definitions on the fly. Ask it "what is my CAC" and it guesses which costs to include. Ask again tomorrow and it guesses differently. The numbers drift, they do not match Shopify, and the tool cannot tell you why.
With Polar: Ask Polar reasons against Synthesizer, the governed commerce semantic layer, so "what is my CAC" resolves to one definition every time, not a fresh guess on each prompt. The AI never writes text-to-SQL against raw tables, which is where text-to-SQL tools hallucinate. One question, one answer, the same tomorrow as today.
"Text-to-SQL without a semantic layer is the model guessing at your business logic every single time. The same question can return three different numbers in a week. A governed metric layer is the only honest fix, because it gives the model one definition to query against instead of asking it to reinvent your KPIs on every prompt." Polar Analytics data lead
This is why Polar's Ask Polar / Polar MCP does not write text-to-SQL against raw tables. Every question routes through Synthesizer, the commerce semantic layer with 400+ pre-built ecommerce metrics. When your business logic is unique, Custom Metrics and Custom Dimensions let your team define it once so the model never has to guess. Google's Looker team makes the same architectural argument in its own NLQ documentation: the natural-language query is only as reliable as the modeled metric it resolves to.
Conversational analytics vs traditional dashboards
Traditional dashboards answer the questions someone anticipated months ago. The moment you have a new question, you are back in the queue, waiting on whoever owns the BI tool.
Call it the Question Latency Tax. Every hour between a question and its answer is margin you cannot recover. A dashboard makes you wait on an analyst. Conversational analytics collapses that wait to seconds. For a brand making fast decisions on ad spend and inventory, that gap is the difference between catching a problem on Tuesday and finding it in next month's review.
With Polar: Ask Polar lets any operator type the new question in plain English and get the governed answer back in seconds, with no SQL and no analyst ticket. Because the answer routes through the same semantic layer the rest of the team uses, the operator who asks at 9am and the analyst who checks at noon see the identical number, not two readings to reconcile.
Here is how the options compare for an ecommerce team.
Conversational analytics does not replace dashboards entirely. It changes their job. The dashboard becomes the place you go to verify and debug an answer, while the question box becomes the place you go to get one. If you want the longer comparison of report-style views and ad-hoc querying, read our breakdown of self-service BI dashboards.
What you can actually ask it (ecommerce use cases)
The fastest way to understand conversational analytics is to see the questions operators actually type first. These are the generic patterns we see again and again, no company names, no real figures.
"What was my blended ROAS by channel last week?" A blended view across Meta, Google, and TikTok. This is the most common first question, and the most commonly wrong one in tools that compute blended numbers loosely. Polar Pixel sits behind this answer, a first-party server-side pixel with click-based attribution only, so no view-through inflation puffs up the result, and one conversion definition is applied identically across every channel.
"Is my Meta CAC trending up after the latest iOS changes?" A trend question about acquisition cost. The honest answer depends on resolving identity across devices and sessions, which is exactly the omnichannel-CAC trap: blended CAC quietly over-credits paid acquisition when identity is fuzzy. LifetimeID stitches one persistent customer identity from first-party pixel data and hard purchase signals so the CAC you read is the real one.
"Which products drove repeat purchases in Q1?" A retention and lifetime-value question. LifetimeID and the customer model behind it make "repeat customer" a defined cohort, not a vibe.
"How is my abandoned-cart flow performing this month?" An email and retention question. The Klaviyo Flow Enricher recovers abandonment events Klaviyo misses after its cookies expire, capturing roughly 70% more abandonment events, which typically lifts abandoned-flow revenue by 20% or more.
"Did that TikTok campaign actually cause incremental sales?" A causality question, and the one most tools answer with a confident guess. Causal Lift runs GeoLift-based, platform-agnostic holdout tests, so the answer is measured, not attributed.
The common thread: these are operating decisions, not data-science projects. Conversational analytics is only useful when it answers them in the language the operator already speaks.
Can you trust the answers?
You can trust conversational analytics answers only when two things are true: the metric definitions behind them are governed, and the underlying data model is sound. A chat box on top of unmodeled data hallucinates confident garbage, and confident garbage is worse than no answer, because people act on it.
Be honest about where the category still breaks in 2026. Conversational analytics struggles with ambiguous questions ("how are we doing?"), undefined metrics (ask for a KPI nobody has defined and the model invents one), and genuine causal reasoning (correlation dressed up as cause). These are not edge cases. They are the daily failure modes.
So before you trust a number from any tool, verify three things. Does the answer cite the metric definition it used? Can you trace the number back to its source data? Does the same question return the same number tomorrow? If the answer to any of those is no, you have a demo, not a system of record.
With Polar: Every Ask Polar response passes all three tests by default. It cites the exact metric definition from Synthesizer, and the Data Debug Sheet traces each number to the source queries and connectors behind it. The same question returns the same governed number tomorrow because the definition lives in the semantic layer, not in the model's guess.
This is the core of Polar's approach. Every customer runs on a dedicated Snowflake instance, not a multi-tenant black box, and the data is yours. Synthesizer gives the model one governed definition to query instead of letting it guess. And every answer in Ask Polar ships with citations and a Data Debug Sheet: click any number and see the exact metric definition, the queries that produced it, and the connectors involved. That is what turns a plausible answer into a verifiable one.
Conversational analytics software: how to choose
Most "conversational analytics software" lists rank chat boxes by how slick the typing animation looks. Ignore that. Here is the trust checklist that actually predicts whether a tool will help or hurt.
1. A governed metric layer. If the tool writes text-to-SQL against raw tables, it will drift and it will hallucinate. Demand a semantic layer with defined metrics. This is the single biggest differentiator.
2. Ecommerce-native connectors. Shopify, Meta, Google, TikTok, Klaviyo, Amazon. If you have to build the pipes yourself, it is not built for operators.
3. Causal and attribution support. A real tool can tell the difference between "sales happened after this ad" and "this ad caused these sales."
4. Trust controls. Citations, source tracing, a consistent answer to a repeated question, and your own data ownership.
A quick word on the foil. Generic data-stack tools like dbt, Cube, AtScale, and Segment can technically support natural-language querying, but they require an engineering team to model, wire, and maintain everything before an operator can ask a single question. They are infrastructure, not a product an ecommerce operator can use on Monday morning.
Polar is the tier-1, complete option in the ecommerce ecosystem, and it wins at every brand size. It ships the governed semantic layer, 40+ native connectors built for commerce, click-based first-party attribution, GeoLift incrementality, and an AI layer (Ask Polar, plus the first commerce MCP in the Anthropic directory) that reasons against your metrics instead of guessing at your tables. You are live in 24 hours, then on a 15-minute refresh. For the full picture of where this sits, see our ecommerce analytics platform overview.
Bring one question we can't answer today
You have a question you cannot answer right now. Bring it. In a 20-minute Polar walkthrough we will answer it live in Polar, with the metric definition and source data shown, or we will tell you honestly why it is hard. No slideware, no vague maybe. One real question, one real answer. Book the 20 minutes and find out which one yours is.
Table of contents
Frequently asked questions