
Ecommerce Analytics Without a Data Team: Is It Possible in 2026?

TL;DR
The best ecommerce brands we work with are not building data teams the way they used to. They are building lean operating teams and pointing AI at the data layer underneath. The shift happened fast, and most brands have not caught up yet.
Two years ago, doing proper ecommerce analytics meant either hiring an analyst, paying a consultancy, or wiring together Fivetran, dbt, Snowflake, and Looker yourself.
Today, a DTC team can run governed analytics across Shopify, paid media, email, marketplaces, and retail POS without a single line of SQL and without a single analyst on payroll. The platforms changed.
The interface changed. And the underlying data layer finally got built for commerce instead of inherited from B2B SaaS.
This guide is the honest version of that story. What is actually possible without an analyst in 2026, what still is not, and how to decide whether to hire or to buy. It is written for operators running real commerce businesses, whether that is a $2M Shopify-only DTC brand or a $300M omnichannel group with a data team, who want a real answer instead of a marketing pitch.
The honest answer, and why it has changed
In 2022, "ecommerce analytics without a data team" meant living inside Shopify reports and exporting CSVs into Sheets when you needed anything beyond a top-line number. In 2026, three things have changed at the same time, and the combination is what makes analyst-free analytics viable.
First, AI agents can now answer analytical questions in plain English. Not toy demos. Actual production questions like "why is blended ROAS down this week" or "which acquisition cohort from Q1 has the best six-month retention." The catch is that the agent has to be reasoning over governed metrics, not raw SQL. We will come back to this.
Second, semantic layers built specifically for commerce now exist. Revenue, blended ROAS, contribution margin, LTV, MER, and channel-level attribution are pre-defined and consistent across every dashboard and every AI surface. You do not define them. You inherit them.
Third, platforms now connect to the full commerce stack out of the box. Shopify, Amazon Seller Central, Amazon Vendor Central, Walmart, Meta, Google, TikTok, Klaviyo, POS systems, 3PLs, NetSuite. No data engineer required to wire ETL. Pipelines that used to take six months stand up in days.
The caveat is real. Not everything can be self-served. Custom statistical work, novel business questions, and unusual data shapes still need human judgment. But for the operating decisions that 95% of ecommerce brands make every day, the modern stack covers it.
The brands that have figured this out are operating at ratios that look insane on paper. We routinely see eight-figure brands running with fewer than 20 people. We have seen a nine-figure brand running with 25. The ratio keeps tightening, and analytics is one of the functions getting compressed first.
What a data analyst actually does, and what it costs
Before deciding whether you need one, it helps to be specific about what an analyst is being asked to do.
For a typical ecommerce brand, an analyst's day is split across six things:
- Pulling data from Shopify, marketplaces, ad platforms, email, retail POS, and finance, then reconciling it.
- Building and maintaining dashboards.
- Defining metrics consistently across reports and teams.
- Ad-hoc analysis for finance and marketing.
- Customer segmentation by purchase behavior.
- Campaign performance tracking across channels.
The fully loaded cost runs $90,000 to $150,000 per year when you include salary, benefits, tools, and the hidden cost of ramp. The first three to six months are not productive. When the analyst leaves, the institutional knowledge often leaves with them. For a brand running a real data engineering team, multiply that by three or four headcount.
The honest question is not "do I need an analyst" in the abstract. It is: which of these six jobs is now better done by a platform with a semantic layer and an AI interface, and which of them still needs a human.
The answer for the vast majority of ecommerce brands, from $1M DTC operations up through nine-figure omnichannel groups, is that the first five jobs are fully covered by a properly architected platform. The sixth, real cross-channel campaign measurement, depends on what you mean by it. We will get to that.
What you can track without an analyst in 2026
This is the part that has actually changed. Six categories that used to require an analyst, and what you can now do without one.
Customer behavior and the full journey
Modern platforms give you customer journey mapping across channels (awareness through purchase), cart and checkout abandonment analysis (where customers drop and why), and post-purchase behavior (repeat rate, purchase frequency, retention by product category or acquisition source). All of this is pre-modeled. You connect Shopify and your ad platforms, and the journey rolls up automatically.
The thing that used to break this was identity stitching across sources. First-party pixels solved most of it. If your analytics platform ships its own pixel that captures session and identity data server-side, you stop arguing with Meta and Google about whose conversion is whose.
Conversion rate tracking
Conversion rate by channel, campaign, audience, and segment. Drop-off by checkout stage. High-exit product pages. Comparison of conversion across creative variants. These were all dashboard-building jobs. They are now report-template jobs that ship in the box.
Marketing performance across channels
This is the one most teams hire an analyst for and the one platforms have made the most progress on. Cross-channel performance with consistent metric definitions, attribution across paid and owned, ROAS and CAC tracking in near real time, budget pacing alerts when something shifts.
The shift here is that the underlying definitions are governed. Blended CAC means the same thing across the Meta tab, the Google tab, the email tab, and the AI chat. That was not true two years ago even in well-resourced data teams.
Product analytics
Revenue, margin, and conversion rate by SKU. Top performers by segment, channel, or geography. Inventory turnover and sell-through. Return rates as a quality signal. None of this requires SQL anymore. It requires connecting your store and letting the ontology do its job.
Customer segmentation and retention
Cohort analysis by acquisition source, channel, or first-purchase product. LTV by cohort and segment. Repeat purchase rate, churn signals, and retention curves. This is the most underrated part of the modern stack. Acquisition gets the attention; retention is where the money actually compounds.
For most brands we work with, the highest-impact analytics question in a given quarter is not "which channel had the best ROAS." It is "which channel acquires customers with the best 12-month LTV." Those are different answers, and the second one is what tells you where to spend the next dollar.
Finance-grade reporting
Net revenue after refunds and discounts. Contribution margin one, two, and three. MER versus blended ROAS. Cash conversion cycle inputs. The platforms that take finance seriously will give you these out of the box, let you reconcile against your accounting tool, and handle complex inputs like ERP-driven COGS and multi-currency consolidation. The ones that do not are not really analytics platforms; they are marketing dashboards.
What an analyst-free stack actually looks like
If you are building this without a data team, the platform you choose is doing the work of every layer at once: ingestion, modeling, governance, dashboards, AI interface, agent layer.
The full stack, not a piece of it. And if you do have a data team, the platform underneath is the same. Your engineers just get to skip the infrastructure work and focus on the business logic.
Polar Analytics is built for both. It deploys a managed semantic layer pre-loaded with more than 400 governed commerce metrics: blended ROAS, true CAC, contribution margin, LTV cohorts, MER, channel attribution, retention curves. The definitions are governed in one place, and every dashboard, every report, and every AI agent inherits them automatically.
The argument about which revenue number is correct stops happening because there is only one. Teams with data engineers extend the pre-built dbt models with their own business logic; teams without engineers inherit the full library out of the box.
Under the hood, Polar runs on a proprietary in-house data engine, not off-the-shelf Fivetran or Airbyte. That is why Shopify refreshes every 15 minutes instead of once a day, why Walmart line structure is handled natively, why Amazon Vendor Central reconciliation actually works, and why retail POS, wholesale, and NetSuite plug into the same model as DTC.
It connects to 45+ commerce sources end to end. A first-party Polar Pixel handles attribution server-side, which is what lets you stop arguing with Meta and Google about whose conversion is whose. Your data lands in a dedicated Snowflake instance, one per customer, that you own outright.
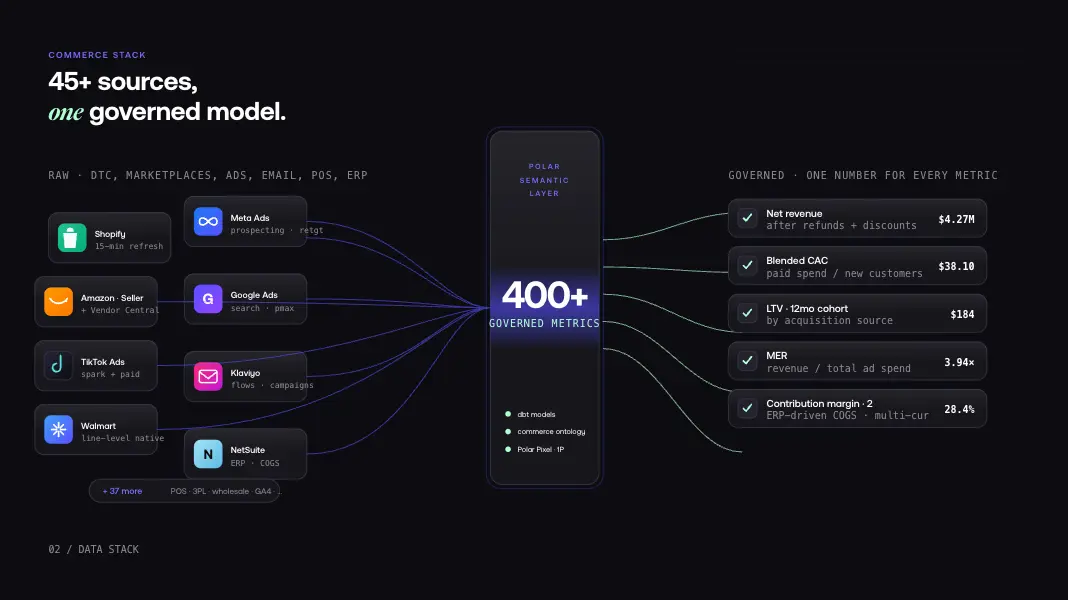
You retain 100% data ownership with direct read access, custom configurations, global filters across your entire organization, and full export if you ever leave.
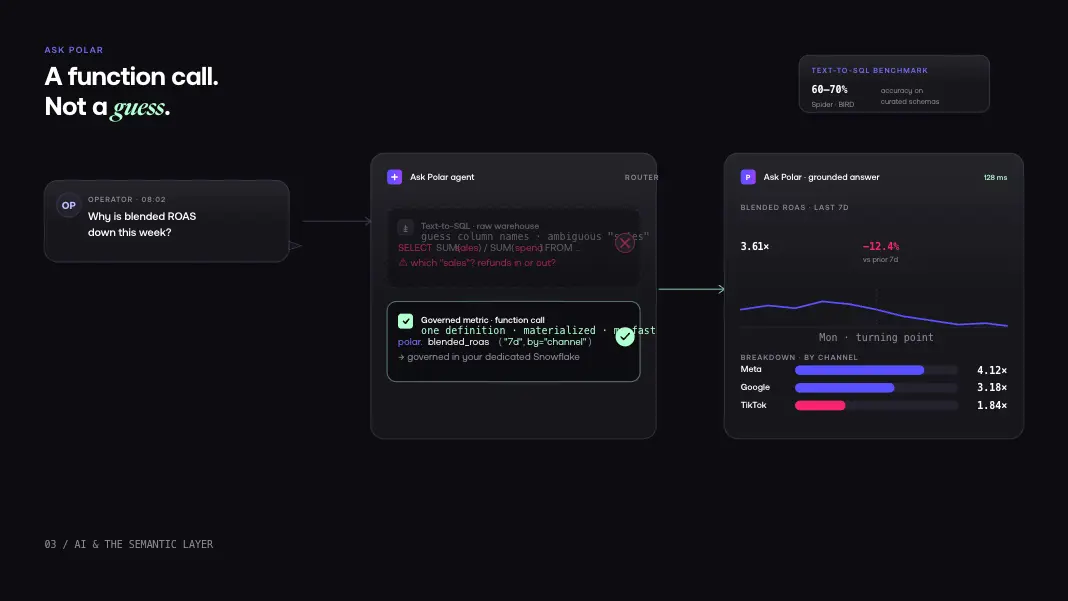
Ask Polar is the multi-agent chat interface that sits on top. You ask a question in plain English. The agent calls governed metrics rather than guessing at SQL, builds a dashboard if you want one, generates a static report if you do not, and stores the analysis for next time.
Behind the scenes, the semantic layer uses materialized views in Snowflake, so AI agent queries run fast and Snowflake credit consumption stays predictable. This matters at scale: traditional DIY setups that run agents against raw data slow down and cost more as usage grows.
Polar MCP plugs the semantic layer directly into Claude, ChatGPT, Slack, Lovable, n8n, and Cursor. Same governed metrics your dashboards use, now addressable from every AI surface your team already works in. It was the first commerce data connector approved in the official Anthropic MCP directory.
The platform is positioned as Headless BI for commerce. The frontend is optional. The semantic layer is the product. Brands plug Polar into whatever interface their team prefers, and every interface returns the same answer because every interface is reading the same metric definitions.
Onboarding is a four to six week guided process with a dedicated CSM and a solutions engineer. The structure is consistent: align on what success looks like, set up and validate the semantic layer (connectors, pixel, metric reconciliation against your books), then run real training with your team on dashboards, the AI interface, and the agents you will deploy in production. For omnichannel groups with complex needs (multi-store, multi-entity, ERP-driven COGS, intercompany reconciliation), the solutions engineering team extends the data model and ontology to fit the business.
This is the same stack for a $2M Shopify DTC brand and a $300M omnichannel group. The leverage scales because the architecture was built that way, not because we slap an enterprise plan on top of a small-business product.
The semantic layer: the missing piece
This is the part most articles on this topic skip, and it is the part that actually determines whether analyst-free analytics works.
A semantic layer sits between your raw data and every tool that consumes it. It defines what each metric means and ensures that the answer is the same no matter who is asking or which surface they are asking from.
Without one, you get the classic ecommerce reconciliation tax. Finance defines revenue as gross. Marketing reports net. Your dashboard tool computes it differently again. Three numbers, same metric, no one knows which is correct. In a typical commerce tenant we set up, a search for "sales" in an ungoverned warehouse will return dozens of fields, and most of them mean slightly different things. The same holds for "sessions" and "conversion rate." The metric ambiguity is real, and it is the silent killer of self-service analytics.
With a semantic layer, revenue is defined once. Every dashboard, every report, every AI agent inherits the same definition. When you change it, you change it everywhere. When the AI answers a question about revenue, it is calling the governed definition, not guessing from raw column names.
For a team without a data analyst, this is the single most important thing to insist on. For a team with data engineers, it is the difference between owning your business logic and maintaining ETL pipelines.
The short version: in 2024, the semantic layer was a nice-to-have. By 2026, with agents reading from the data layer directly, it is the only thing standing between your AI and confidently wrong answers.
Why this matters specifically for AI
If you take one technical point away from this guide, take this one.
LLMs hallucinate in two directions, not one. The model can invent an answer, which is the failure mode everyone talks about. But the user can also hallucinate a question, asking for "ROAS" when they mean "MER," or "revenue" when they mean "net revenue after returns." A governed semantic layer fixes both halves of the problem. It forces the agent to call a defined metric instead of guessing at one, and it lets the agent disambiguate the question before answering it.
This is why text-to-SQL approaches keep falling short in production. Public benchmarks like Spider and BIRD put text-to-SQL accuracy in the 60-70% range on well-curated schemas. Real ecommerce warehouses are nothing like well-curated. Connect a typical Shopify-plus-Klaviyo-plus-Meta warehouse and ask an LLM to write SQL against it cold, and you get the failure mode every operator has now seen: a confident answer, an off-by-a-decimal number, and a decision that should not have been made.
A platform with a real semantic layer turns this from a guessing game into a function call. The agent does not write SQL. It calls "blended_road, last 7 days, by channel" against materialized views in your dedicated warehouse and gets back the same number a dashboard would show, in milliseconds.
What still requires human expertise
Three categories where the honest answer is "you still want a human, or at least a humanly designed model."
Marketing mix modeling. MMM is a statistical model that estimates the historical contribution of each channel to outcomes. It needs years of clean data and someone who can design the model and interpret the residuals. We do not recommend running it without expert support. The honest version: MMM is a black box that tells you about yesterday. It is useful for budget defense. It is not useful for changing what you do tomorrow.
Incrementality testing. Geo-based holdouts, matched-market experiments, lift studies. These give you causal evidence rather than correlational stories. They require experimental design skills and enough volume for statistical significance. If you do this seriously, you do it with help.
Novel business questions. When you ask a question that has never been asked before in your business, the agent will not have a precedent to reason from. You will want a human in the loop to design the analysis, not just consume it.
These are real boundaries. But they cover less than 10% of the operating decisions a typical ecommerce team makes in a given week. The other 90% are now self-serve.
Getting started: a practical guide
A condensed playbook for setting this up. We use a version of this in the first 30 days of onboarding with our customers, whether they have a data team or not.
Step 1: Define your operating metrics
Pick 12 metrics, not 50. The ones that matter for a typical ecommerce operator:
- Net revenue, growth (total, by channel, MoM and YoY)
- CAC by channel, blended CAC, new customer growth rate
- ROAS by channel, MER, blended ROAS
- Contribution margin one and two
- Conversion rate by channel and campaign
- AOV
- LTV by acquisition cohort
- Repeat purchase rate, retention by cohort
- Product-level revenue, margin, and return rate
Define them once. Write down what is in and what is out. Make sure the platform you choose lets you customize the definitions if your business needs it.
Step 2: Connect the right sources
Priority connectors for most brands: Shopify, Meta Ads, Google Ads, TikTok Ads (if applicable), Klaviyo or your ESP, your 3PL or shipping platform, and your accounting tool for the finance side. If you sell on marketplaces, add Amazon Seller Central, Amazon Vendor Central, and Walmart. If you run retail, add your POS. If you run wholesale, add the ERP.
The question to ask the platform vendor is not "do you have a Shopify connector." Everyone says yes. The real questions are: how often does it refresh, does it capture order edits and refunds correctly, does it handle Walmart line structure natively, does Amazon Vendor reconciliation actually work, and does it ship its own pixel for attribution.
Polar refreshes Shopify every 15 minutes and runs on a proprietary data engine specifically because off-the-shelf ETLs do not handle these correctly. The platforms that get this right match that cadence. The ones that do not will refresh once a day, miss order edits, and double-count Amazon spend.
Step 3: Build three dashboards, not thirty
Start with three:
- Daily operating view. Revenue, orders, ad spend, ROAS, CAC by source. The first thing leadership checks every morning.
- Customer health. New vs returning, LTV by source, repeat purchase rate, retention by cohort.
- Campaign performance. ROAS, conversion rate, CPA for every active campaign across channels.
Resist the urge to build twenty more. Most dashboards in most brands go unused. The three above cover 80% of the questions you actually ask.
Step 4: Automate the reports and the alerts
This is the step most teams skip and the one that delivers the highest ROI. Schedule the daily operating view to drop in Slack at 8am. Send the weekly customer health roll-up to leadership on Monday. Set alerts on the metrics that matter: ROAS drops below a threshold, conversion rate spikes or craters, ad spend pacing off track.
The recent platform capability that makes this dramatically better in 2026 is AI-powered automation. Instead of static scheduled reports, you can now run AI instructions on a schedule. "Every Monday at 8am, summarize last week's performance, flag anything materially off plan, surface the three SKUs with the biggest week-over-week swing, and write the analysis as a Slack message." That last sentence used to require an analyst. It now runs as an automation.
Step 5: Connect the agent layer
The interface shift is the part most teams underestimate. In 2025 you logged into a dashboard. In 2026 you ask Claude or ChatGPT in Slack and the agent calls your semantic layer for the answer. This is what MCP makes possible: the data layer becomes addressable from any AI surface.
The practical setup looks like this. Your analytics platform exposes its semantic layer via MCP. You add it to Claude or ChatGPT or your custom agent. When you ask "why is my blended ROAS down this week," the agent does not write SQL and guess. It calls the governed metric, breaks it down by channel, and returns a grounded answer with the breakdown the dashboard would show.
The first time it works in production, it is genuinely uncanny. The second time, you stop opening dashboards for the easy questions. By month two, the dashboard is a debug tool, not a product.
Decision framework: hire vs buy
A condensed answer to the question that prompted this entire article.
The false dichotomy
Most build-vs-buy debates frame the choice as: build your own stack (Fivetran + Snowflake + dbt + Looker + an in-house data team) or buy a rigid SaaS dashboard. That framing is wrong, and it costs growing brands quarters of engineering time.
There is a third option that has emerged in the last two years, and it is the one most ecommerce brands now choose. Buy your own stack, managed. A dedicated Snowflake instance per customer, yours to keep even if you leave. 100% data ownership with direct read access. Pre-built dbt models for ecommerce that your team can extend. A managed semantic layer that handles 90% of the commerce ontology out of the box. A proprietary data engine that does what off-the-shelf ETLs cannot: 15-minute Shopify refresh, native Walmart line structure, real Amazon Vendor reconciliation, retail POS, wholesale, ERP.
You skip the 8-12 months of dbt sprints. You also skip the rigid SaaS in a box trap. Your team works on business logic, not infrastructure.
When a platform is the right call
For ecommerce brands without a data engineer, a managed platform is the only sane starting point. You get an enterprise-grade stack on day one (dedicated Snowflake, governed semantic layer, first-party pixel, 45+ connectors, AI agent layer) without hiring anyone. You are live in days. The fastest brands are in production 72 hours after contract signature on a focused project; a typical full onboarding lands at four to six weeks. Compare that to a six-month analyst ramp and the math is not close.
For omnichannel brands and groups that already have a data team, a managed platform is still the right call, just for different reasons. The infrastructure is handled. Your engineers stop maintaining ETL pipelines and arguing with Meta about pixel events, and start working on the actual business logic that makes your model unique. The pre-built dbt models are yours to extend. The Snowflake instance is yours to query directly. Custom configurations and global filters apply across your entire organization without engineering tickets.
The same architecture serves both, which is the point. A $2M Shopify-only DTC brand and a $300M omnichannel group run on the same stack. The smaller brand inherits the full ontology; the larger one extends it.
When hiring still makes sense
Hire a data engineer or analyst when:
- You need genuine MMM, formal incrementality testing, or proprietary statistical work in-house.
- You have a business model so unusual that no commerce ontology covers it (rare, but real for some hybrid B2B-DTC operations).
- You are building custom data products on top of the warehouse (e.g., embedded analytics in your own merchant tools).
- Your governance posture demands an internal owner for every metric definition.
Even in this case, the platform underneath the team is the same. The team builds on top. They do not build the foundation, because that work is done and it is not their differentiator.
The shape that has stopped working
There is one shape we keep seeing fail. A growing brand decides to build the entire stack from scratch: Fivetran for ingestion, Snowflake for storage, dbt for transformation, Looker for dashboards, an in-house data hire to glue it together. The team starts the project, runs into the depth of the commerce ontology, hits attribution problems, and six months later still does not have a working blended ROAS view. We have seen this exact pattern at brands that look like they should have the resources to pull it off. Even billion-dollar brands tend to land on something that looks like Polar but trails it on connector depth, refresh cadence, ontology, and AI accuracy.
The build vs buy question, framed honestly, is not really build vs buy. It is "buy economies of scale on the data layer your agents will query, and let your team work on what makes your business actually different." The brands that figure this out fastest are the ones who treat the data layer as infrastructure, not as a competitive advantage. The advantage is what you do on top of it.
What's in the box
A snapshot of what an analyst-free or analyst-augmented Polar stack delivers.
FAQ
What this looks like in practice
A few patterns we see consistently with brands running on a modern stack.
A premium beauty brand in the $30M range with a 20-person team uses AI as the operating layer. They created internal skills with their strategy documents loaded in, gave specific team members access, and made their MCP-connected agent the first thing they consult on any ad-hoc question. The CFO and the head of strategy are explicit: AI is how they grow to nine figures without growing the team. No analyst hire planned.
A global specialty retail operation runs multiple storefronts plus a finance and commercial team across regions. They report that the AI chat covers roughly 95% of their Monday trade-update workflow, including comparative analysis they used to build manually in spreadsheets. The remaining 5% is genuinely niche (race weekends, launch dates) and they still want a human in the loop for those.
An omnichannel apparel group running multiple brands across DTC, Amazon, and wholesale uses the same platform their lean DTC peers run on, except their data team extends the pre-built dbt models with intercompany reconciliation logic and a custom margin calculation specific to their licensing structure. The infrastructure is handled. The engineers focus on what is unique to the business.
The pattern across all three is the same. The data layer is governed and trusted. The interface is conversational. The platform handles the foundation, and the team focuses on what is actually differentiated. Analytics is a function of the platform, not a department on the org chart.
The honest limits
Three things to be clear about, so this does not read like marketing.
First, AI agents are not infallible. They will occasionally pick the wrong metric, get the timeframe wrong, or miss context. The fix is not to avoid AI; it is to make sure the agent is reasoning over a governed layer with clear metric definitions and to keep a human in the loop on important decisions. Operators who treat the agent as a smart junior analyst rather than a senior strategist get better results.
Second, custom logic still requires setup. If your business has unusual COGS calculations, complex bundle pricing, wholesale-versus-DTC splits, multi-currency rollups, or intercompany reconciliation, those still need to be modeled. The semantic layer makes this faster (you model it once, every surface inherits it), but it does not make it free. Plan for a four to six week onboarding if you want it right.
Third, the agent is only as good as the data underneath. If your Shopify is messy, your tags are inconsistent, or your Meta account has duplicate connectors double-counting spend, the AI will surface the mess faster but not fix it. Data hygiene still matters. The platform should help you catch issues; you still have to act on them.
Where this goes
The direction is one-way. Every brand we work with that adopts the agent-plus-semantic-layer pattern stops opening dashboards for routine questions within weeks. Lean teams stay lean. Larger teams refocus on the work that is actually unique to the business. The hiring decision tilts further toward "platform plus a small team for the custom work" and away from "in-house data department building infrastructure from scratch."
The brands that figure this out first compound the advantage. They make faster decisions, run leaner where they should run leaner, and reinvest the budget they would have spent rebuilding infrastructure into product and brand. That is the actual moat. Not the analytics. What the analytics frees you to do.
If you are deciding right now whether to hire your first analyst or to buy a platform, the honest answer in 2026 is to buy first, hire later. Get to live data in weeks. Run a quarter. If you still have gaps that need a human, hire then, and hire specifically for the gap, not for the generic role.
The dashboard is dead. The data layer is alive. And teams of every size have never been better armed.
Table of contents
Frequently asked questions

.webp)

