How to Implement a Semantic Layer: Step-by-Step for Ecommerce Teams
TL;DR
Building a semantic layer is one of the highest-leverage investments an ecommerce data team can make. When your analysts, business users, and AI agents all query the same governed definitions, your data becomes a single source of truth not a source of arguments. But the path from "we need a semantic layer" to a working, adopted system requires a clear plan.
This guide covers the prerequisites, the seven core implementation phases, a realistic timeline, and how modern tools from dbt to managed platforms like Polar Analytics fit into the picture.
What Is a Semantic Layer (and Why It Matters for Implementation)
A semantic layer sits between your raw data stored in a warehouse like Snowflake, BigQuery, or Databricks and the tools that consume it: dashboards, spreadsheets, BI platforms, and AI agents. It translates complex data structures into concepts your team already understands: revenue, ROAS, LTV, contribution margin.
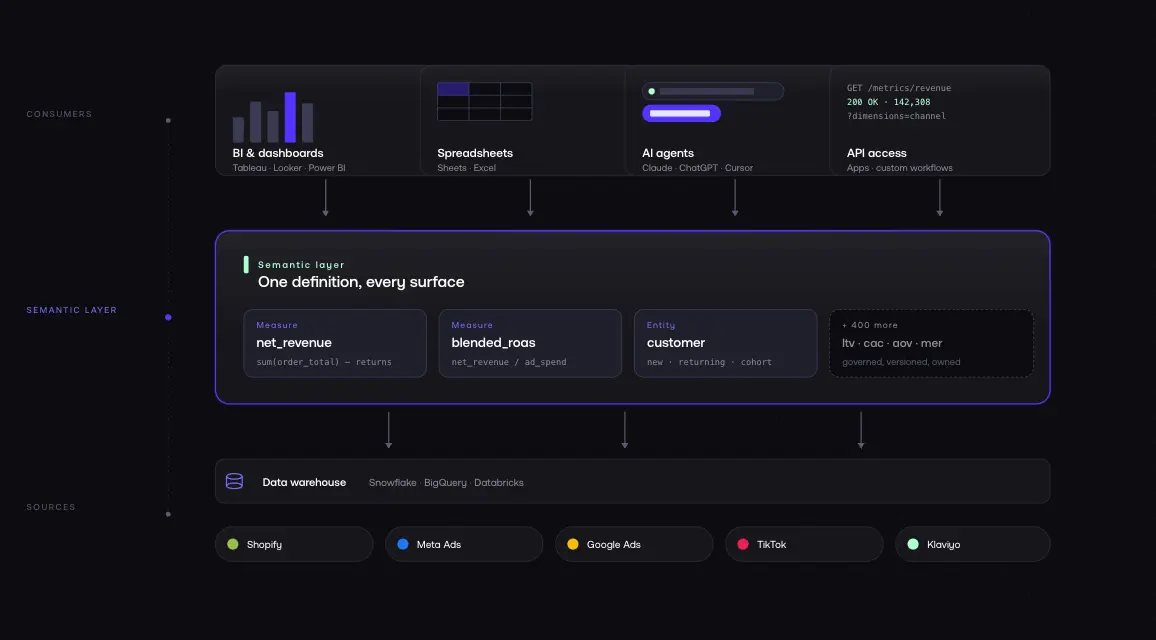
The semantic layer stores definitions and rules in one place. It provides a unified view across every tool and team. The modeling work defining how entities relate, how measures are calculated, how dimensions are structured happens once in the semantic layer, not repeatedly in individual dashboards and SQL scripts.
Without a semantic layer, analysts write the same SQL in five different places, users get different numbers depending on where they look, and governance is theoretical. For ecommerce businesses, the value is especially direct: consistent data across Shopify, Meta, Google, TikTok, and Klaviyo without manual reconciliation every Monday morning.
Before You Start: Prerequisites
Audit Your Current Data Stack
Map everything you have: data sources (Shopify, Meta Ads, Google Ads, TikTok, Klaviyo, Recharge, GA4), data warehouse or storage (BigQuery, Snowflake, or direct API), current tools (BI tools, spreadsheets, dashboards, any existing models), and known issues (where do numbers currently conflict?).
This audit surfaces the reconciliation problems your semantic layer will need to solve.
Document everything data lineage starts here.
Identify Your Core Business Metrics
You do not need to define every metric upfront. But you need your top 10–15 the ones that drive decisions:
- Revenue gross vs. net, returns excluded
- AOV average order value
- ROAS return on ad spend (blended and by channel)
- CAC customer acquisition cost
- LTV lifetime value (30, 60, 90-day windows)
- Conversion rate sessions to orders
- Repeat purchase rate customers with 2+ orders
- Contribution margin revenue minus COGS minus ad spend
- MER marketing efficiency ratio
- Blended CPA cost per acquisition across all channels
Write down how you currently define each one. Note which data source is authoritative. If your team has conflicting definitions today which is normal documenting the disagreement is the first step toward resolving it.
Get Stakeholder Buy-In
Before building, make sure Finance, Marketing, and Operations agree on core terms. This is a business alignment task, not a data engineering task.
The most common reason semantic layer implementations fail is not technical: business users did not agree on definitions before the build started.
Ensure these conversations happen before the first line of code is written.
Phase 1: Define Your Business Logic
This is the most important phase. You are converting concepts from "whatever the dashboard says" into explicit, documented definitions.
Create Formal Definitions for Each Metric
For each metric, document:
- Name: Blended ROAS
- Definition: How much revenue we generate for every dollar of ad spend, across all channels
- Formula: (Net Revenue - Returns) / Total Ad Spend
- Data sources: Shopify (revenue), Meta/Google/TikTok (ad spend)
- Filters: Exclude test orders, use order_created_at in calendar month UTC
- Owner: Who maintains and approves changes
This level of detail ensures every tool that queries the semantic layer dashboards, spreadsheets, AI agents gets the same answer.
Define Business Rules and Edge Cases
Business rules are where semantic layers earn their keep. Document each rule explicitly:
- A customer is "new" if they have zero prior orders in Shopify at the time of purchase
- Subscription revenue from Recharge is included in LTV but excluded from first-order ROAS
- Google Ads conversion value uses Shopify as source of truth, not Google's reported figure
These rules live in the semantic layer not scattered across individual SQL scripts.
Align Terms Across Teams
Marketing might define ROAS differently than Finance. Data science might use a different LTV model than the CFO.
Get agreement before building. Create a shared glossary that everyone references.
Phase 2: Map Your Data Sources and Build Your Data Model
Inventory Every Data Source
For ecommerce, your typical sources:
- Shopify: orders, products, customers, returns, subscriptions
- Meta Ads: campaigns, ad sets, spend, reported conversions
- Google Ads: campaigns, keywords, spend, conversion value
- TikTok Ads: campaigns, spend, conversions
- Klaviyo: email revenue, campaign performance, flows
- Recharge: subscription revenue, churn
- GA4: sessions, behavior, funnel data
For each source, document what data it contains, refresh frequency, known tracking limitations, and which warehouse table it lands in.
Build a Logical Data Model
The logical data model is the conceptual blueprint. It defines entities (Customer, Order, Product, Session, Campaign, Channel), relationships (Order → Customer, Session → Campaign), dimensions (channel, product category, region, date), and measures (SUM of revenue, AVG of order value, COUNT of orders).
The logical model is distinct from the physical model (your actual database tables). The semantic layer maps between them exposing clean concepts while hiding warehouse schema complexity.
Establish a Source-of-Truth Hierarchy
You will find overlapping and conflicting fields across sources: Shopify total_price vs. Meta reported_revenue vs. Google conversion_value. Document every conflict, then establish a hierarchy:
Your semantic layer enforces this hierarchy automatically.
Phase 3: Choose Your Implementation Architecture
Option A: Build It Yourself (Code-First)
Use dbt Semantic Layer + Cursor or a similar tool. Your data engineering team builds definitions in code typically YAML alongside dbt models.
Best for: Organizations with 2+ dedicated data engineers who need full control over complex models and custom logic.
Pros: Maximum flexibility. Full ownership definitions live in your codebase. Version-controlled via Git. Integrates with existing dbt models and warehouse.
Cons: Significant engineering time (8–12 months for full deployment). Ongoing maintenance as rules evolve. Requires SQL expertise across the team.
Option B: Managed Platform (Buy)
Use a purpose-built platform like Polar Analytics. The platform provides the semantic layer, data connectors, and AI query capabilities you connect your data and configure definitions.
Best for: Ecommerce businesses that want a working semantic layer in days, not months. Teams without dedicated data engineering.
Pros: Data connects in minutes, syncs within 24–72 hours, attribution calibrates in ~10 days. 400+ pre-built ecommerce metrics (ROAS, LTV, CAC, AOV, MER, and hundreds more). 40+ native connectors. Built-in governance and access controls. API access for AI agents.
Cons: Some enterprise requirements may exceed platform capabilities.
Option C: Hybrid
Build custom logic for proprietary data structures. Use a managed platform for standard ecommerce metrics and integration. Increasingly common: use dbt for transformation and testing, integrate with a managed platform for ecommerce-specific metrics.
Phase 4: Build Your Semantic Models
Define Entities, Relationships, and Measures
Each semantic model includes:
Entities: Customer (Shopify customer records), Order (Shopify order data enriched with attribution), Product (product and variant data), Session (GA4 session data with UTM parameters), Campaign (unified campaign data across platforms), Channel (marketing channel classification).
Relationships: Order belongs to Customer. Order is attributed to Channel. Session is attributed to Campaign. Product appears in Order at line-item level.
Dimensions: Channel (organic, paid social, paid search, email, direct), product category, customer region, acquisition cohort, order date, new vs. returning customer.
Measures: SUM(net_revenue), AVG(order_value), COUNT(DISTINCT customer_id), SUM(ad_spend), SUM(net_revenue) / SUM(ad_spend) for blended ROAS.
Write Definitions in Code (or Configuration)
If building with dbt, definitions live in YAML files:
semantic_models:
- name: orders
model: ref('fct_orders')
entities:
- name: order
type: primary
expr: order_id
- name: customer
type: foreign
expr: customer_id
dimensions:
- name: channel
type: categorical
expr: attribution_channel
- name: order_date
type: time
expr: order_created_at
measures:
- name: net_revenue
agg: sum
expr: net_revenue_usd
- name: order_count
agg: count_distinct
expr: order_id
If using a managed platform, you configure these through a UI but the semantic rigor is the same.
Document Data Lineage
Data lineage tracks how data flows from raw source tables through transformations to final metrics. When someone questions a revenue figure, you can trace from the Shopify webhook to the final aggregated metric in seconds. Teams that maintain lineage documentation can identify the impact of any source change before it causes downstream issues.
Phase 5: Implement Governance and Access Controls
A semantic layer without governance is just another place where numbers live.
Assign Metric Owners
Each metric needs a named owner:
Revenue, AOV, conversion rate → Finance or Revenue Operations.
ROAS, CAC, MER → Marketing or Growth.
LTV, repeat purchase rate → Analytics.
Contribution margin → Finance.
When a definition needs to change, the owner reviews and approves. This prevents silent definition drift.
Set Up Change Management
Version control your definitions. With dbt, YAML definitions live in Git full history of every change, with review and rollback. For managed platforms, use change logs and approval workflows.
Implement Row-Level Security
If you manage multiple brands, regions, or business units: Brand A's team sees only Brand A data. Regional managers see only their region's revenue. External partners see only shared dashboards. Row-level security in the semantic layer handles this without separate databases or complex application-level controls.
Monitor Data Quality
Set up monitoring for missing data (sources that stopped refreshing), anomalous values (revenue spikes that might indicate tracking errors), and consistency checks (does Shopify revenue match your warehouse revenue within tolerance?).
Phase 6: Connect Your Analytics Tools
BI and Dashboards
Connect your BI tools Tableau, Looker, Power BI, or any other platform to your semantic layer API. Every dashboard now queries the same governed definitions. When Marketing opens their ROAS dashboard and Finance opens their revenue report, they are reading from the same source.
Spreadsheets
Connect Google Sheets or Excel directly to the semantic layer. Users build their own analyses with live data using the same definitions as every other tool.
AI Agents and Natural Language Queries
LLMs can query your warehouse, but without a semantic layer, they query raw data and they get confused by physical schema complexity, technical column names, and conflicting rules. Connect AI agents to the semantic layer instead. It provides business context (the AI knows "revenue" means net revenue after returns), enforced definitions (the AI uses your specific ROAS formula), access controls (the AI only sees data the user is authorized to query), and clean translation from natural language to SQL using your logic.
For ecommerce teams using AI-powered analytics, a semantic layer is not optional it is the prerequisite. Without it, AI agents give wrong answers. With it, they give the same answers as your best analyst.
Developer and API Access
Expose your semantic layer via API for custom applications, internal tools, and data science workflows. This lets engineers build on top of governed definitions instead of reinventing them.
Phase 7: Test, Validate, and Deploy
Parallel Running
Run your semantic layer alongside existing dashboards for 2–4 weeks. Compare numbers daily. Every discrepancy is a learning opportunity: either the semantic layer definition needs refinement, or the old dashboard was wrong (more common than you would expect).
Validation Checklist
Before launch, verify:
- Revenue matches Shopify admin within acceptable tolerance (< 0.5% variance)
- ROAS matches what your media buyer uses in each platform
- LTV calculations produce expected cohort results
- Contribution margin matches Finance's spreadsheet model
- Row-level security works users only see authorized data
- AI agents return accurate answers to standard questions
- Data quality alerts fire for known anomaly scenarios
Rollout Strategy
Deploy to one team first usually Marketing, since they have the most acute data pain. Run parallel reporting for 2 weeks. Gather feedback. Fix issues. Then expand to Finance, Operations, and other teams.
Do not attempt a big-bang deployment. Adoption requires trust, and trust is built through a phased rollout.
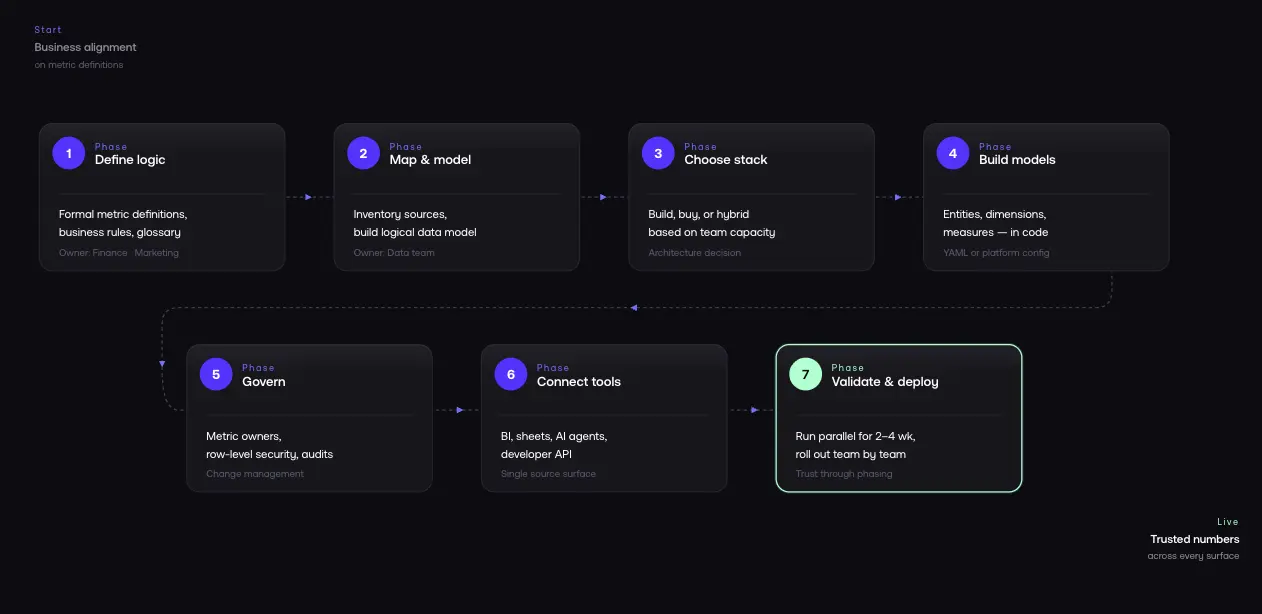
Implementation Timeline
.webp)
This timeline assumes a managed platform approach. Building from scratch with dbt typically takes 8–12 months connectors, YAML semantic views, testing, and ongoing maintenance add up fast.
Note for teams evaluating platforms via trial: a 30-day trial typically covers data connection and dashboard access, but attribution data needs approximately 10 days to calibrate and AI agents require trained context to perform well. Budget your evaluation accordingly the full value of a managed semantic layer becomes clear in weeks 3–4.
Common Mistakes to Avoid
Trying to define everything before launching anything. Start with your top 5–10 metrics. Ship them. Then add more. Perfectionism kills adoption.
Skipping stakeholder alignment. If Finance and Marketing still disagree on what "revenue" means after Phase 1, your semantic layer will have the wrong definition.
Treating governance as optional. Without metric owners and change management, definitions will drift. Six months after launch, no one will know why the numbers shifted.
Not planning for AI access. Design for AI queries from the start. The semantic layer is the infrastructure that makes AI analytics reliable.
Choosing the wrong architecture for your team size. A 10-person DTC brand does not need to build a dbt project from scratch. A 200-person multi-brand organization probably does not want to depend entirely on a single managed platform. Match architecture to actual capabilities.
How Polar Analytics Compresses Implementation
Polar Analytics is a managed semantic layer for ecommerce designed to compress the 8-week timeline into days for DTC teams.
What it provides: 400+ pre-built ecommerce metrics (ROAS, LTV, CAC, AOV, MER, contribution margin) with ecommerce-correct logic. A first-party server-side pixel captures every customer event — including those lost to iOS restrictions, Safari cookie limits, and ad blockers and performs cross-device stitching via email, IP, and device identifiers. A separate Shapley-based attribution model distributes credit across every touchpoint, replacing platform self-reported last-click logic.
40+ native connectors (Shopify, Meta, Google, TikTok, Klaviyo, Recharge, Stripe, Amazon). Managed infrastructure (a dedicated Snowflake instance per customer, reconciliation, pre-aggregation, caching). Governance and access controls. AI-ready APIs (Ask Polar for natural language queries, Polar MCP for Claude/ChatGPT/Cursor).
Polar handles the engineering work of Phases 2 and 4 connectors are pre-built and 400+ metric definitions ship out of the box (80% inherited, 20% customizable to your business). Data connects in minutes and syncs within 24–72 hours.
Attribution data calibrates in about 10 days.
Full onboarding without custom work typically takes two to three weeks compared to 8–12 months for a code-first approach.
The trade-off is customization: if you have unusual logic or complex proprietary data structures, a DIY approach offers more control.
For most ecommerce businesses, the pre-built layer is exactly what you need.
FAQ
Table of contents
Frequently asked questions