Semantic Layer ROI: How to Measure Business Impact
TL;DR
You want to invest in a semantic layer. Your CEO wants to know: what is the return?
The challenge with semantic layer investments is that they are infrastructure investments, they make other things better, but the benefits are not always obvious from a single line item. There is no "semantic layer revenue line." The ROI shows up as better decisions, improved data quality, and less time reconciling numbers across teams.
Measuring the business impact requires a clear framework: one that translates the technical value of a semantic model into language that business users, finance, and executive stakeholders actually care about. That means connecting consistent business logic and centralized metric definitions to hard dollar figures reduced overhead, faster decisions, and risk avoidance.
This guide gives you that framework. You will learn how to calculate semantic layer ROI, build the business case for leadership, and benchmark your numbers against real-world data from organizations that have already made the investment.
Why ROI Matters for Semantic Layer Investments
The "Infrastructure Does Not Have ROI" Myth
Infrastructure investments often get pushed back because they do not have an obvious revenue impact. But infrastructure that enables better decisions and faster execution absolutely has ROI.
A semantic layer is not a cost center. It is a decision-enabling foundation. Every time someone makes a better marketing decision because they trust the data, every time a report request that took two weeks now takes 30 seconds, every time an AI analytics tool gives an accurate answer instead of a hallucination that is ROI.
What makes semantic layer ROI harder to calculate than, say, a new ad channel is that the value is distributed across every team that touches data. The business intelligence team gets it. The data engineering team gets it. Marketing managers get it. That distributed impact is actually a strength it means the semantic layer improves outcomes across the entire organization.
Why Decision-Makers Need Numbers, Not Philosophy
When you present a semantic layer business case, do not lead with "better data culture" or "single source of truth." Lead with hours saved, wrong decisions avoided, and time-to-insight accelerated.
CFOs want payback period. CMOs want faster ROAS optimization. CTOs want engineering efficiency. Speak their language. The semantic model is a product that delivers measurable value, treat it that way.
What Makes Semantic Layer ROI Unique
Translating Technical Value into Business Concepts
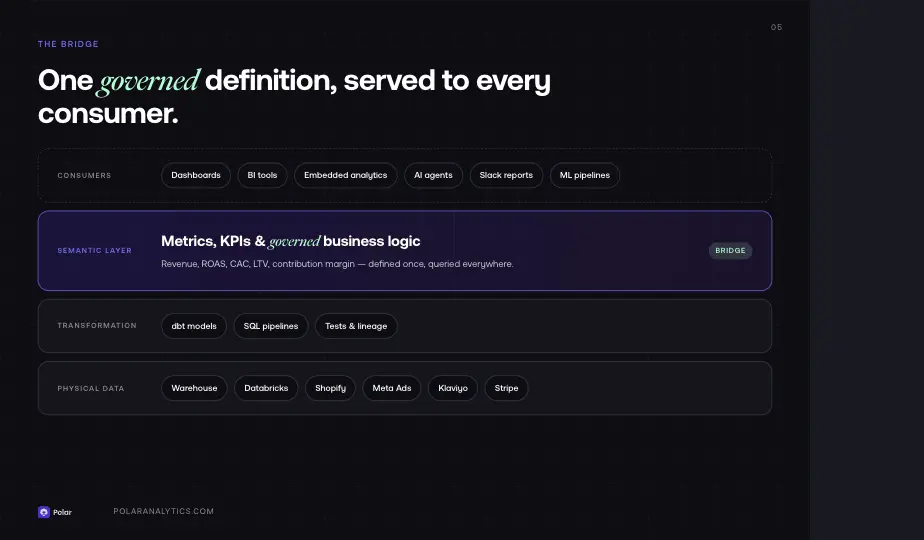
One of the most effective ways to build the business case is to stop speaking in infrastructure terms and start translating the technical value into concepts that every stakeholder can immediately grasp. The semantic layer bridges two worlds: the physical data layer (raw tables, schemas, data structures) and the business logic layer (definitions, KPIs, and the intuitive language that business users already use daily).
Without this bridge, technical users write SQL, business users wait for reports, and the gap between data and decision widens. This translation problem is the root cause of most data team inefficiencies and it is the core ROI driver of a well-implemented semantic layer.
Democratization of Data Access
Data democratization is not just a buzzword. It is a measurable outcome: when business users can access governed analytics without writing a single query, the number of data-driven decisions in your organization increases. The semantic layer makes data access intuitive it exposes familiar business terms instead of raw column names and complex data structures.
This shift from gated to self-service access is crucial. It means less dependency on technical users for every reporting request, more time for analysts to do actual analysis, and a more data-literate organization overall.
The Cost of NOT Having a Semantic Layer
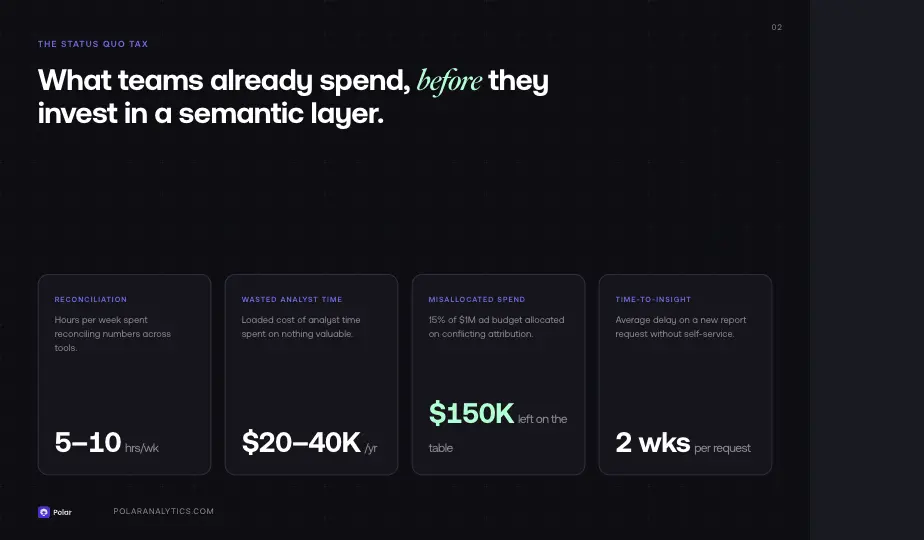
Before calculating ROI, calculate the cost of the status quo. Most data teams significantly underestimate how much they spend maintaining inconsistent logic and reconciling metrics across tools.
Hours Wasted on Metric Reconciliation
For a typical ecommerce team with 2+ data analysts, 5–10 hours per week are spent reconciling numbers between tools. That is 260–520 hours per year. At $75/hour loaded cost, that is $20,000–$40,000 per year in analyst time spent on nothing valuable.
Without a semantic layer, every tool maintains its own version of your metrics. Your data warehouse has one definition of revenue. Your BI tool has another. Your ad platform reporting has a third. Data teams spend their time bridging these gaps instead of generating insights. These silos where each platform holds its own private version of the truth are one of the most expensive inefficiencies in modern data organizations.
Wrong Decisions from Inconsistent Data
When ROAS numbers conflict between platforms, marketing budgets get allocated based on incomplete or incorrect data. A DTC brand spending $1M annually on ads that allocates 15% of budget incorrectly due to inconsistent attribution is leaving $150,000 on the table in suboptimal spend.
The root cause is almost always missing or conflicting definitions different tools applying different logic to the same underlying data. A semantic model eliminates this by centralizing all metrics in one governed, accessible layer. When every tool shares the same definitions, wrong decisions from interpretation gaps become a thing of the past.
Slow Time-to-Insight
Report requests that take two weeks to fulfill represent two weeks of delayed decisions. In fast-moving ecommerce, two weeks of delayed optimization on a $50K/month ad spend can mean significant revenue impact.
With no semantic layer, every new report request requires a data engineer to write queries against the warehouse, validate the numbers against existing definitions, and rebuild logic that may already exist somewhere else in the stack. This is pure waste.
Tool Redundancy and Rebuilding Costs
When every new data source requires rebuilding metrics across multiple dashboards and tools, the data team spends time rebuilding instead of analyzing. This is wasted engineering capacity that compounds over time as your data stack grows. Teams that add 3–4 new integrations per year can easily spend 80+ hours per year on this rebuilding work alone.
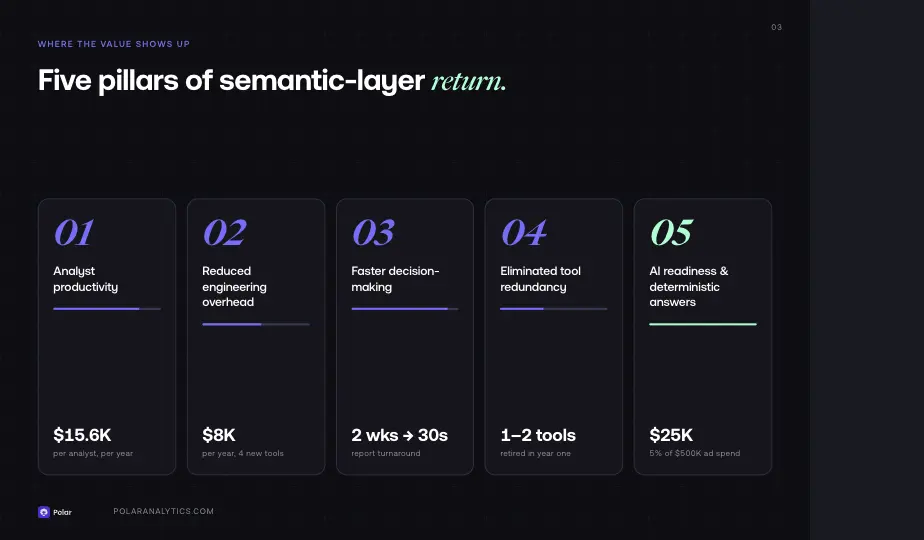
The Five ROI Pillars of a Semantic Layer
Pillar 1: Analyst Productivity Gains
With a semantic layer, analysts spend less time on report requests and more time on analysis. Business users get self-service access to governed data with consistent definitions already baked in. Analysts recover 3–4 hours per week that were previously spent on ad-hoc queries and metric reconciliation.
Value: 4 hours × 52 weeks × $75/hour = $15,600 per analyst per year
Multiply that across your data teams and the number grows fast. A team of three analysts sees $46,800 in recovered productivity annually before accounting for the quality improvement in their actual analysis work.
Pillar 2: Reduced Data Engineering Overhead
Data engineers spend less time rebuilding metrics when new tools are added. A new ad platform used to require updating 4 dashboards, 2 spreadsheets, and a BI tool. With a semantic model, it is one connector added to the layer the logic and definitions are already defined and reusable.
Modern data stack tools like dbt make it easier to define transformation logic, but dbt alone does not solve the semantic layer problem. The definitions still live in the transformation layer, not in an accessible, governed model that business users and downstream tools can query directly. Platforms like Databricks provide powerful compute infrastructure, but they do not replace the semantic layer's role in exposing data through governed, human-readable definitions. A semantic layer built on top of dbt, Databricks, or your warehouse delivers the full ROI.
Value: 20 hours saved per new tool × 4 new tools/year × $100/hour = $8,000 per year
Pillar 3: Faster Decision-Making
Dashboards that used to take 30 seconds to load now take 2 seconds. Reports that took two weeks now take 30 seconds to generate. The semantic layer acts as a caching and abstraction layer that dramatically improves query performance.
This is time-to-insight ROI and it compounds. When business users trust the data and can get answers instantly, they make more data-driven decisions. Governance improves not just because the definitions are correct, but because people actually use the data.
Value: Estimate based on your current report backlog. If you have 10 pending report requests, each representing 5 days of delay, that is 50 days of delayed decisions per year.
Pillar 4: Eliminated Tool Redundancy
With a universal semantic layer serving metrics to every tool, you can eliminate redundant BI licenses, spreadsheet workflows, or custom dashboard builds. Organizations that have rationalized their reporting stack after implementing a semantic layer typically eliminate 1–2 tools within the first year.
Value: Estimate based on tools or workflows you can consolidate. A single BI tool license at $500/user/year across 10 users is $5,000/year and that is before factoring in the engineering time to maintain it.
Pillar 5: AI Readiness and Deterministic Analytics
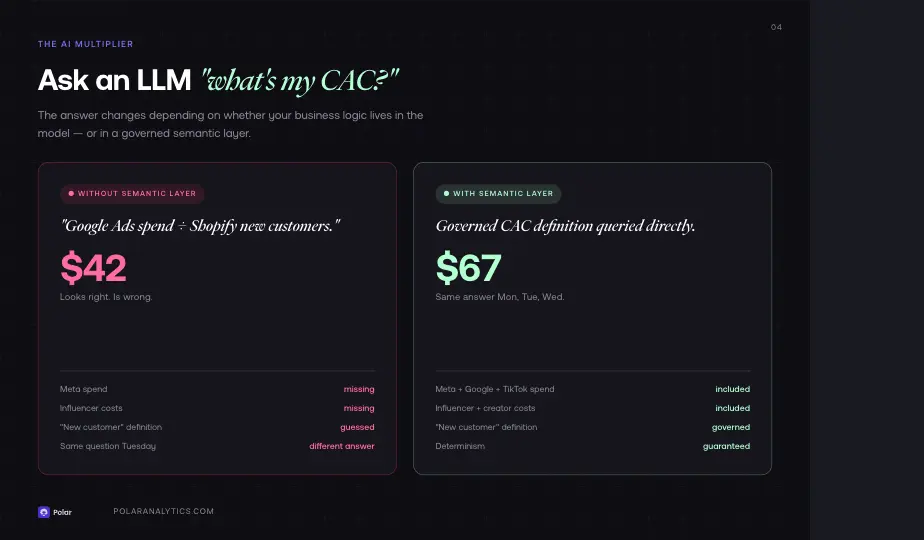
This is where the ROI conversation has shifted dramatically. Without a semantic layer, AI analytics tools and large language models will hallucinate numbers. They do not understand your business context what "revenue" means to your company, how your KPI definitions differ from industry defaults, or how your customer segmentation logic works.
As one ecommerce operator put it: ask an LLM "what's my CAC?" without a semantic layer and it will do its best pull Google Ads spend, divide by new customers from Shopify, and give you an answer that sounds right but is wrong. It will miss your Meta spend, your influencer costs, your definition of "new customer" versus "reactivated." The answer is confident and incorrect.
With a semantic layer, AI agents query governed data with logic already applied. The result is deterministic: you ask the same question on Monday, Tuesday, and Wednesday and get the same answer every time. Context windows, model updates, and prompt variations do not change the output because the semantic layer not the LLM owns the definitions.
This is how you go from AI that gives you impressive-sounding wrong answers to AI that gives you answers you can act on. And as more teams deploy AI agents for media buying, retention, financial reporting, and executive summaries, the semantic layer becomes the trust infrastructure that makes every agent reliable.
Value: Hard to quantify, but if your AI analytics tool is providing incorrect ROAS for budget allocation, the potential cost is significant. For a $500K/year ad spend, even a 5% improvement in allocation quality from more accurate AI insights is $25,000/year.
How to Calculate Your Semantic Layer ROI
Step 1: Quantify Current Data Friction Costs
Calculate what you currently spend on:
- Hours spent reconciling numbers across teams (data teams, marketing, finance)
- Hours spent on report requests that could be self-service
- Engineering time spent rebuilding metrics for new tools
- Business intelligence maintenance overhead
Track these for two weeks and multiply by 26 to get an annual figure. Most organizations are surprised by how large this number is.
Step 2: Estimate Productivity Gains
Estimate how many hours per week each persona will save:
- Data analysts: 4 hours/week
- Data engineers: 2 hours/week
- Marketing managers: 2 hours/week
- Business users (self-service reporting): 1–2 hours/week
Apply your fully-loaded hourly cost for each role. Do not forget to include the cost of delayed decisions slow reporting is not just a time problem, it is a strategy problem.
Step 3: Factor in Risk Reduction
Estimate the value of avoiding wrong decisions based on data quality issues:
- If your ad spend is $500K/year and inconsistent data causes 10% suboptimal allocation, that is $50K at risk
- If your financial reporting relies on metrics that differ across systems, the compliance and audit risk has a real dollar value
- A semantic layer with proper governance reduces this risk significantly
Step 4: Calculate Implementation Costs
- Managed platform: Subscription cost per year (a service that handles the infrastructure, connectors, and updates for you)
- Build-it-yourself: Engineering time × fully loaded cost (do not forget ongoing maintenance typically 20–30% of initial build cost annually)
- Migration: Time to migrate existing pipelines and definitions to the new semantic model
Step 5: Compute Net ROI
ROI = (Annual Value of Benefits − Annual Cost) / Annual Cost × 100
A payback period under 12 months is realistic for most organizations. Many managed semantic layer platforms deliver payback within the first 2–3 months.
Real-World ROI Benchmarks
What the Market Data Shows
Organizations implementing semantic layers consistently report ROI in the range of 100%–500%, with payback periods measured in months, not years. The range is wide because it depends on starting conditions: teams with more data sources, more analysts, and higher ad spend see outsized returns because the friction costs they eliminate are proportionally larger.
The key patterns observed across implementations:
- Mid-size organizations (500–2,000 employees) see the largest absolute savings because they have enough data complexity to generate significant friction but are still agile enough to adopt quickly.
- High-spend ecommerce brands see the fastest payback because every percentage point of improved allocation on a six- or seven-figure ad budget translates directly to revenue.
- Multi-tool environments see the highest tool consolidation savings organizations running 4+ analytics tools often eliminate 1–2 within the first year.
80% Improved Dashboard Performance
Organizations with well-tuned semantic layers report up to 80% improvements in dashboard query performance, turning 30-second load times into sub-second responses. For business users who rely on dashboards for daily decisions, this improvement drives measurable increases in data-driven behavior across the organization.
The AI Multiplier Effect
The most significant emerging ROI driver is AI readiness. Teams that have implemented a semantic layer before deploying AI agents report dramatically better outcomes: accurate automated reports, reliable natural-language querying, and AI-powered workflows that operate on trusted data instead of best-guess SQL. Organizations building AI agents without a semantic layer are finding that the cost of incorrect AI outputs wrong budget recommendations, flawed forecasts, unreliable executive summaries quickly exceeds the cost of the semantic layer itself.
Advanced ROI Topics
Embedded Analytics and Semantic Models at Scale
Embedded analytics delivering data insights directly inside your product, app, or customer-facing service represents one of the highest-ROI use cases for semantic layers. Without a semantic layer, every embedded analytics feature requires custom compute logic, bespoke pipelines, and ongoing maintenance. With a semantic layer, the logic is defined once and can be pushed to any embedded context with a single API call.
For SaaS products and ecommerce platforms that want to offer their customers performance dashboards, the semantic layer dramatically reduces the engineering cost to build and maintain those features.
Data Virtualization and the Logical Data Model
One of the frequently underappreciated features of a mature semantic layer is data virtualization the ability to query data as if it exists in a single, unified logical model, even when the physical data lives across multiple sources, schemas, or cloud platforms.
The logical model defined in your semantic layer maps business terms to the underlying physical data without requiring that data to move or be replicated. This is crucial for organizations with complex environments: multiple warehouses, cloud and on-premise sources, or data from acquisition targets with their own schemas.
Data virtualization reduces compute costs (no ETL duplication), simplifies governance (one place to manage access and definitions), and makes the semantic layer much more powerful as data grows in volume and variety.
Machine Learning and the Semantic Layer
Machine learning models trained on inconsistent or poorly governed data will produce unreliable outputs. The semantic layer creates a clean, consistent access layer that is essential for effective ML feature engineering and model training.
When your ML pipelines pull features from semantic models rather than raw warehouse tables, you get consistent definitions, enforced quality, and reproducible training sets. This is especially important for ecommerce brands using ML for LTV prediction, churn modeling, or personalization use cases where small inconsistencies in input definitions can significantly degrade model accuracy.
How to Present the Business Case
The One-Slide Summary for Your CEO
Problem: We spend X hours per week reconciling numbers across teams. We have Y conflicting versions of "revenue." Our AI analytics tool gives us answers we cannot trust because it lacks business context.
Solution: A semantic layer centralizes our logic, metrics, and governance into one accessible model serving consistent data to every tool, dashboard, and AI agent.
Investment: $X/year (or X engineering weeks to build and maintain)
Return: $Y/year in recovered analyst and engineering time, Z% reduction in incorrect decisions, improved quality across the stack
Payback period: Z months
What CFOs Want to See
CFOs care about payback period and NPV. They also care about risk reduction. Speak their language:
- Payback period under 12 months
- Clear annual cost (platform subscription + any implementation services)
- Quantified annual benefits broken down by category
- Risk reduction: wrong decisions avoided, governance improvements, compliance support
What CMOs Want to See
CMOs care about faster decisions, trusted data for optimization, and KPI accuracy. Speak their language:
- "No more 'which number is right?' meetings"
- "ROAS you can trust for budget allocation consistent definitions across every channel"
- "Self-service reports in 30 seconds instead of 2 weeks"
- "AI insights powered by your actual business logic, not hallucinated numbers"
What CTOs Want to See
CTOs and engineering leaders care about build vs. buy, maintenance burden, and the power of the underlying platform. The crucial question is whether the semantic layer integrates with your existing stack your warehouse, dbt, Databricks, and cloud services or requires rebuilding what you already have.
A well-chosen semantic layer platform reduces maintenance burden rather than adding to it. It should plug into your existing infrastructure, not replace it. Show your CTO the compute savings from data virtualization and the long-term cost reduction from eliminating per-tool metric rebuilds.
Semantic Layer ROI for Ecommerce Brands
The DTC Brand ROI Model ($1M–$50M Revenue)
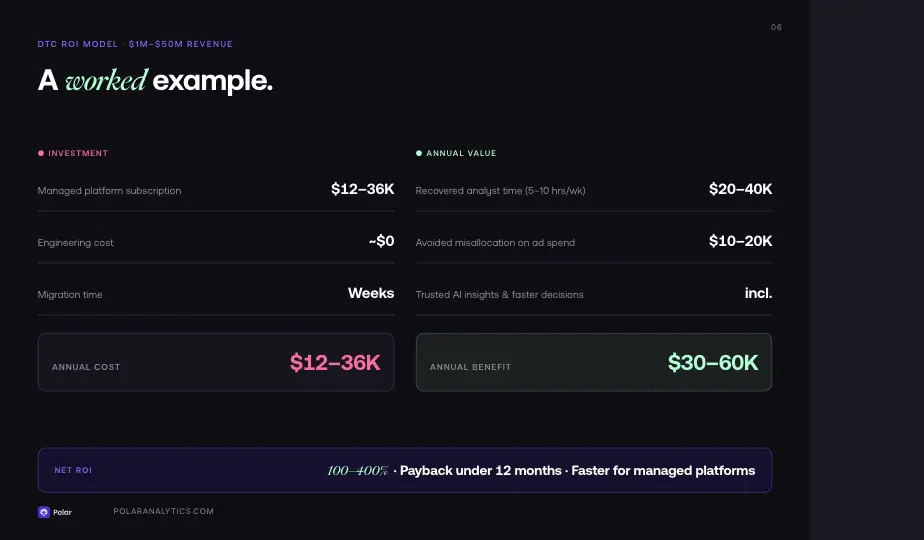
For a DTC brand in this range, the ROI calculation looks like:
- Current pain: 5–10 hours/week reconciling numbers across teams = $20K–$40K/year
- Report backlog: 2-week average delay on requests = significant opportunity cost on ad spend decisions
- AI analytics: Missing business context = wrong ROAS, wrong attribution, wrong allocation
Estimated annual value: $30K–$60K in recovered productivity and avoided bad decisions
Managed semantic layer cost: $12K–$36K/year
ROI: 100%–400%
For retail businesses with significant ad spend and complex multi-channel attribution, the ROI is even higher because improved data quality translates directly into better media allocation.
Key Levers for Ecommerce
- Channel spend optimization: Consistent KPI definitions across channels = better ROAS data = better allocation
- LTV improvement: Governed customer analytics with consistent definitions = better targeting and retention strategy
- Team efficiency: Self-service analytics for business users = data teams analyzing instead of building reports
- Integration speed: New data sources connect to the semantic layer once, not to every tool separately
- Embedded analytics: Deliver governed, consistent metrics directly inside your product or customer-facing app without rebuilding the data logic for every new feature
How Polar Analytics Accelerates ROI
Polar Analytics delivers ROI by compressing the implementation timeline and eliminating the engineering overhead that custom builds require.
Day-One Consistency
Polar comes with 400+ pre-configured ecommerce metrics, ROAS, LTV, CAC, AOV, contribution margin, MER, and more with governed definitions that are locked across every query, dashboard, and AI interaction. There are no reconciliation meetings and no "which platform is right" debates. Every metric definition is accessible, auditable, and consistent from the moment you connect your data.
Hours to Insights, Not Weeks
With 45+ native connectors (Shopify, Meta, Google Ads, TikTok, Klaviyo, Recharge, Stripe, Amazon, and more), integration takes hours, not weeks. New data sources plug in without requiring data engineering rework the metrics and logic are already defined and reusable. Teams that add new channels or tools do not rebuild dashboards; they connect and go.
AI That Does Not Hallucinate
Ask Polar is an AI-powered data analyst that lets users query their analytics in natural language. Because it operates through the semantic layer, every response is deterministic: the same question returns the same answer every time, regardless of model updates or prompt variations. The AI does not guess at your definition of net revenue or CAC it uses the governed definition you have set.
For teams deploying AI agents beyond Polar's interface, Polar MCP (Model Context Protocol) gives external tools like Claude, ChatGPT, and automation platforms like n8n real-time access to governed Polar data. This means you can build automated executive summaries, Slack-based reporting workflows, or AI agents for media buying all powered by trusted, governed metrics rather than raw SQL guesswork.
Custom Metrics: Define Once, Use Everywhere
Beyond the built-in library, Polar lets you define custom metrics using your own formulas and logic. A custom definition of gross profit, net revenue, or any brand-specific KPI is created once and immediately available across dashboards, reports, and AI queries. The semantic layer embeds those definitions so the formula stays the same everywhere.
First-Party Attribution with the Polar Pixel
The Polar Pixel a first-party, server-side tracking pixel collects multi-touch attribution data that is not subject to the same data loss as third-party cookies. This feeds directly into the semantic layer, giving you attribution data you can trust for budget allocation decisions. Combined with governed metrics, it means your ROAS is calculated from accurate, first-party data end to end.
Implementation Cost
Implementation cost is subscription only. Engineering cost is near zero. ROI shows up in day-one consistency, recovered analyst and engineer hours (3–4 hours/week per analyst), reduced tool redundancy, and better decisions from trusted KPIs.
Best Practices for Maximizing Semantic Layer ROI
Getting the most out of your investment requires following a few key practices throughout implementation and ongoing operation.
Start with your most painful silos. Do not try to migrate everything at once. Identify the two or three concepts where inconsistent data causes the most friction usually revenue, ROAS, or customer lifetime value and build your semantic model around those first. Early wins drive adoption and create internal advocates.
Define terms collaboratively. The most effective definitions are created with input from both technical and business users. Data engineers understand the physical data. Business stakeholders know what the terms should mean. Bringing both groups together before implementation prevents costly rework.
Subscribe to your own analytics. Build a practice of sharing performance reports powered by the semantic layer internally. When teams discover insights through a governed, consistent source, the value of the investment becomes self-evident and the business case for expanding coverage writes itself.
Log and track adoption metrics. Create a simple dashboard that tracks usage how many queries are running, which teams are using it, how often definitions are accessed. This data is crucial for demonstrating ongoing ROI and continuing to earn executive support.
Invest in lightweight governance. A semantic layer is not a one-time build. It needs someone who reviews new definitions, someone who approves changes to existing ones, and a clear way for stakeholders to request additions. The community of practitioners and business users who maintain the semantic model is as important as the technology itself.
Conclusion
Semantic layer ROI is real and quantifiable. The key is to calculate the cost of the status quo inconsistent metrics, data teams buried in reconciliation work, business users blocked from self-service analytics and translate those costs into the language your leadership uses.
For ecommerce brands, the ROI shows up in analyst productivity, improved data quality, consistent metrics across tools, and AI analytics powered by your actual business context rather than hallucinated numbers. The democratization of data access bridging the gap between complex infrastructure and intuitive, human-readable concepts is the most powerful organizational outcome a semantic layer delivers.
The foundation is in place when your data teams stop rebuilding and start analyzing, when business users trust the KPI on their dashboard because it comes from governed, centralized definitions, and when your AI-powered tools query data that reflects your actual business logic rather than raw data artifacts.
Calculate your semantic layer ROI. Book a demo to explore what Polar can do for your teams and get a custom ROI estimate based on your data stack and current workflow.
Table of contents
Frequently asked questions