Shopify Attribution Models Explained: Which One Should You Use?
TL;DR
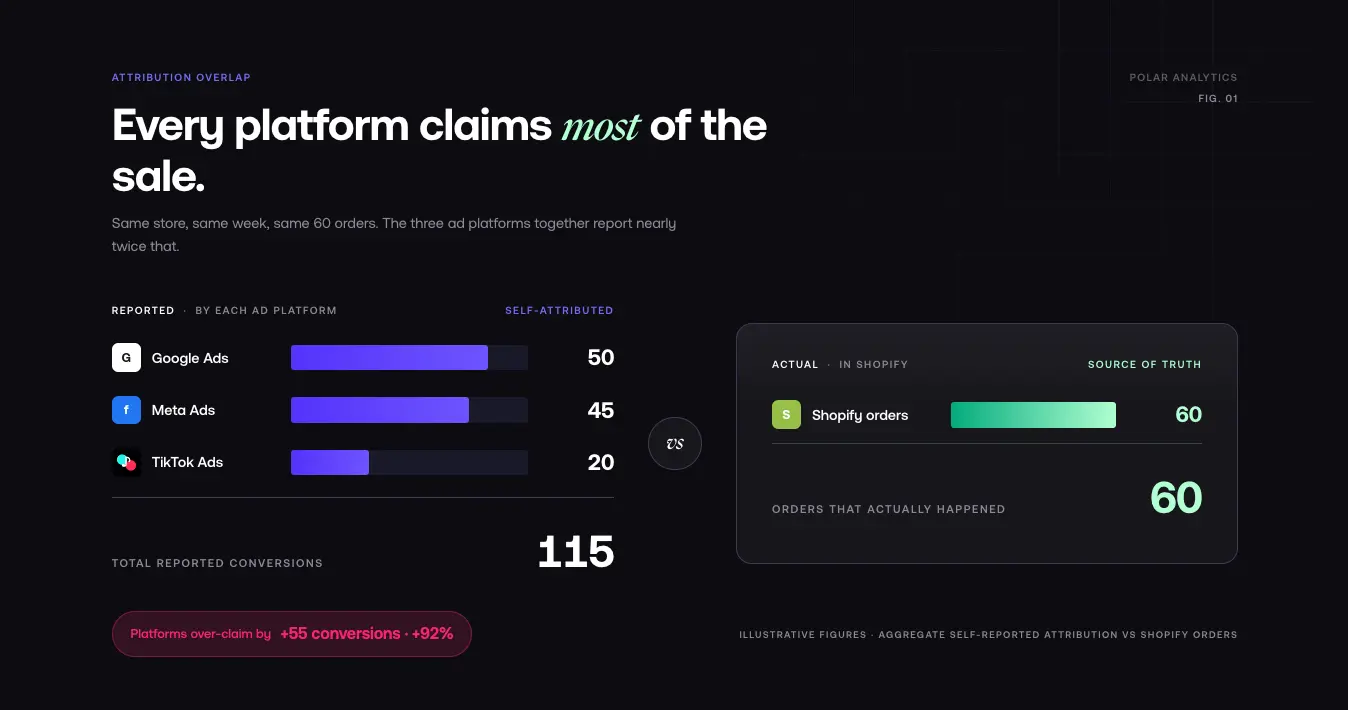
Here is a situation that plays out in every Shopify store that runs paid ads: you open Google Ads and it shows 50 conversions. You open Meta Ads Manager and it shows 45. You open TikTok Ads and it shows 20. You go to Shopify and you have exactly 60 orders. Every platform claims credit for nearly all of them, and when you add up the conversions across all platforms you get 115 almost double your actual sales.
This is not a tracking error. This is how attribution works or rather, how it breaks down when every platform measures its own credit without knowing what the others are doing. Understanding attribution models is the single most important skill for any Shopify merchant who wants to allocate budget intelligently across paid, email, and organic channels. It is the difference between knowing which marketing efforts actually drive revenue and just guessing.
This guide explains every attribution model, how they work, when to use each one, and how to set up independent attribution tracking so you can see the full picture including the direct, organic, and paid sources your ad platforms never tell you about.
What Is Attribution in Shopify?
Attribution is the process of determining which marketing touchpoints receive credit for a conversion. When a customer clicks a Meta ad, then searches for your brand on Google two days later, then clicks an email link and makes a purchase which channel gets the credit?
The answer depends entirely on which attribution model you use. Different models give credit differently, and they all produce different numbers. Your ad platforms use their own default models without telling you that the numbers they show are only one version of the truth.
How Shopify Tracks Marketing Touchpoints
When you connect your ad platforms to Shopify through the Google & YouTube channel, Meta channel, or TikTok channel Shopify records the referring source for each order. It stores UTM parameters (including utm_source and utm_campaign), referrer data, and click identifiers that tell Shopify where each customer came from immediately before purchasing.
Shopify then assigns credit based on the attribution model selected in your marketing reports. The model you choose determines how credit is distributed across the touchpoints in a customer's journey.
Shopify's Default Attribution Model
By default, Shopify uses last-click attribution for its marketing reports, which gives 100% of the credit to the last marketing touchpoint before a purchase. If a customer clicks a Google ad, reads an email, and buys directly, the email gets 100% of the credit.
Shopify also offers first-click, linear, and any-click models in its marketing reports. Important: time decay, position-based, and data-driven attribution are not available natively in Shopify's reporting. These are industry-standard models we explain below because they are available in dedicated attribution tools and ad platforms but you cannot select them inside Shopify's admin. We note which models are Shopify-native and which require external tools throughout this guide.
Attribution Windows Explained
An attribution window is the period of time during which touchpoints are tracked. If a customer clicks an ad on March 1, ignores your brand for two weeks, then buys on March 15 whether that first click gets credit depends on your attribution window.
Common windows: 7 days (favors bottom-of-funnel touchpoints), 14 days, 30 days (standard for many platforms), and 90 days (captures more of the awareness-to-purchase journey).
One important setting to understand is Meta's attribution windows. Meta now defaults to 7-day click or 1-day click attribution view-through windows were deprecated in 2026. Previously, Meta's 1-day view window claimed credit for users who merely saw an ad without clicking, which significantly inflated reported conversions. While view-through is gone, Meta's click windows still create discrepancies with Shopify because of differences in how each platform defines and records a conversion event.
Every Attribution Model Explained
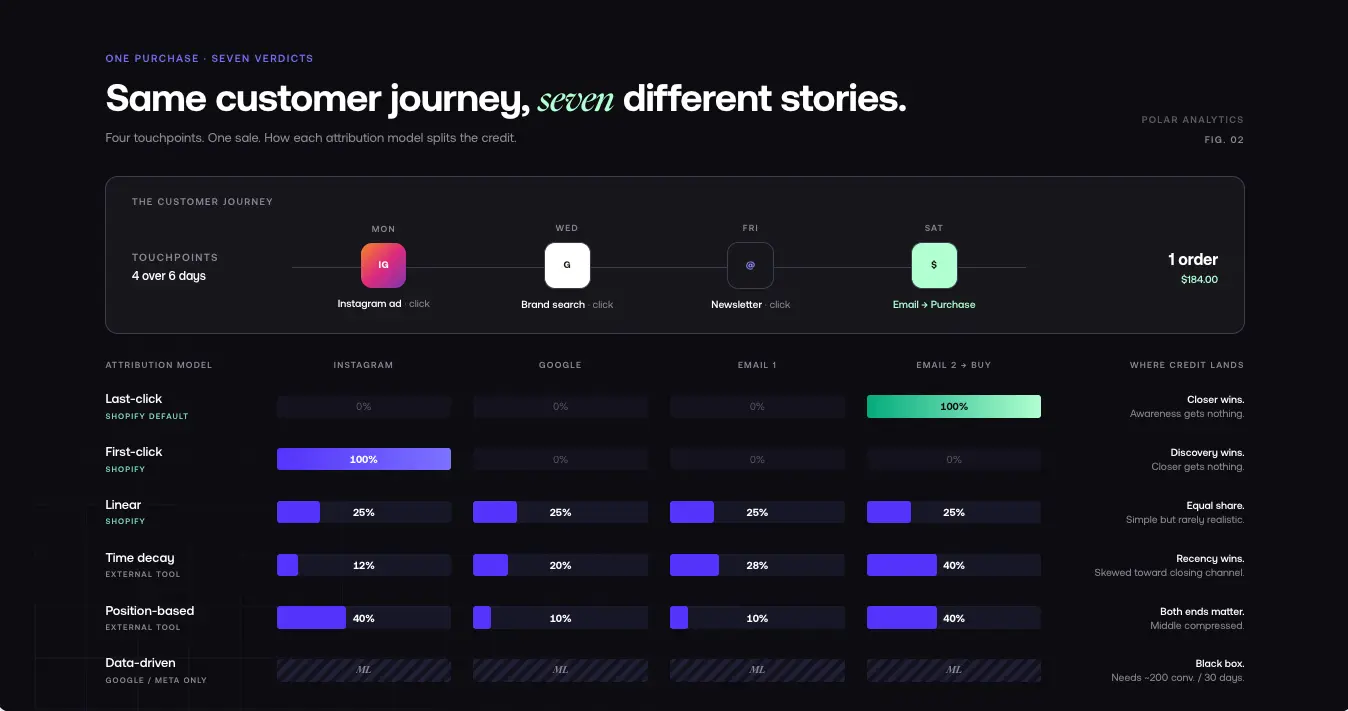
Here is a complete breakdown of every model, using the same example customer journey to show how credit shifts.
The scenario: A customer sees your Instagram ad on Monday and clicks it but does not buy. On Wednesday, they search for your brand on Google and click your search ad. On Friday, they receive your email newsletter and click a link. On Saturday, they click through to your store from the same email and buy.
Four touchpoints, one purchase. Here is how each model distributes the credit.
Last-Click Attribution
Available in: Shopify (default), Google Ads, Meta Ads
How it works: The last marketing touchpoint receives 100% of the credit.
In this example, the Saturday email click gets all the credit. The Instagram ad, Google search ad, and Friday email click all get nothing.
When to use: Useful for understanding which channels close sales at the bottom of the funnel. If you are running retargeting campaigns or focused on capturing demand from people who already know your brand, last-click tells you which channel is closing.
Pros: Simple to understand. Reflects what your ad platforms already measure. Useful for short sales cycles.
Cons: Gives zero credit to awareness-building channels. Brand search campaigns always get last-click credit even if they did not influence the purchase. Can make paid social look like it does not work, even when it is driving awareness that leads to later conversions.
First-Click Attribution
Available in: Shopify, Google Ads
How it works: The first marketing touchpoint receives 100% of the credit.
In this example, the Monday Instagram ad gets all the credit. Everything else gets nothing.
When to use: Useful for understanding which channels drive initial awareness and discovery. If you are building a new brand or investing in upper-funnel campaigns, first-click shows you which channels generate initial interest.
Pros: Values the beginning of the customer journey. Helps you understand which channels drive discovery.
Cons: Ignores every touchpoint after the first one including the one that closed the sale. Can make retargeting look ineffective.
Linear Attribution
Available in: Shopify, some ad platforms
How it works: Credit is distributed equally across all touchpoints.
In this example, each of the four touchpoints gets 25% of the credit.
When to use: Useful when you want a balanced view that does not over-weight either the beginning or the end of the journey. A good starting point for multi-channel analysis.
Pros: Gives credit to every touchpoint. Avoids the extreme bias of first-click or last-click.
Cons: Equal credit is rarely realistic; the first touch is rarely as important as the last touch. Can obscure the true influence of each touchpoint.
Any-Click Attribution
Available in: Shopify
How it works: Every touchpoint that the customer clicked on receives equal credit. Unlike linear, any-click ignores non-click events like impressions or passive views.
In this example, three of the four touchpoints involved intentional clicks (Instagram ad click, Google ad click, Friday email click). Each gets 33.3% of the credit. The Saturday email click-through may or may not count separately depending on how Shopify deduplicates the session.
When to use: Useful when you want to focus only on intentional customer actions clicks rather than passive impressions.
Pros: Only credits intentional actions. Avoids giving credit to passive impressions.
Cons: Still distributes credit equally among clicks. Ignores non-click touchpoints that may have played a role.
Time Decay Attribution
Not available natively in Shopify. Available in: Google Ads, dedicated attribution tools.
How it works: Credit is distributed across touchpoints, with more recent touchpoints receiving more credit. The decay curve is typically exponential the last touchpoint gets the most, earlier touchpoints get progressively less.
In this example with a 7-day decay curve: Saturday email click gets ~40%, Friday email click ~28%, Wednesday Google search ~20%, Monday Instagram ~12%.
When to use: Useful when you want to acknowledge upper-funnel touchpoints but still give appropriate credit to bottom-funnel channels that closed the sale. A middle ground between first-click and last-click.
Pros: Recent touchpoints get appropriate credit while acknowledging earlier awareness-building. Better reflects actual customer behavior than first or last-click alone.
Cons: Requires defining a decay curve, which introduces a subjective assumption. Still undervalues discovery in long consideration journeys.
Position-Based (U-Shaped) Attribution
Not available natively in Shopify. Available in: dedicated attribution tools.
How it works: Credit is weighted toward the first and last touchpoints, with middle touchpoints splitting the remainder. A common split is 40% first touch, 40% last touch, 20% distributed among the middle.
In this example: Monday Instagram (first) gets 40%, Saturday email (last) gets 40%, Wednesday Google + Friday email split the remaining 20%.
When to use: Useful when you believe both discovery and conversion are equally important the channels that bring customers in and the channels that bring them back to buy. Works well for brands with longer sales cycles.
Pros: Values both discovery and conversion. More realistic than equal distribution for most ecommerce journeys.
Cons: Middle touchpoints can be undervalued. The 40-40-20 split is arbitrary the right split depends on your specific journey. Requires a tool outside Shopify.
Data-Driven Attribution
Not available natively in Shopify. Available in: Google Ads (with sufficient volume), Meta Ads.
How it works: Rather than following a preset rule, data-driven attribution uses machine learning to analyze your actual conversion paths and determine how much credit each channel should receive based on its true influence.
When to use: Data-driven attribution is now the default for all new conversion actions in Google Ads there's no hard minimum threshold to activate it. For optimal accuracy, Google recommends approximately 200 conversions and 2,000 ad interactions within a 30-day period. Below that volume, the model still runs but may be less stable, and Google may supplement with modeled conversions.
Pros: Based on your actual data, not assumptions. Can identify touchpoints that generic models miss. Continuously improves.
Cons: Requires large volumes. Only available within individual platforms, not as a cross-platform model. The algorithm is a black box you cannot fully explain why it assigns credit the way it does.
Which Attribution Model Should You Use?
For brand awareness campaigns use first-click. Instagram ads, YouTube, influencer partnerships, and content marketing typically do not drive direct conversions. Without first-click attribution, these channels get zero credit and your awareness budget looks ineffective even when it is the reason for the entire purchase.
For performance and conversion campaigns use last-click or time decay. If your primary goal is driving immediate conversions through search ads and retargeting, last-click tells you which channels are closing. Time decay is a good middle ground if you run both awareness and conversion campaigns.
For a balanced full-funnel view use position-based or linear. If you run the full funnel from social awareness to search consideration to retargeting, position-based gives credit to both channels that bring customers in and channels that bring them back. Linear is available natively in Shopify and provides a simpler balanced view.
For advanced scaling brands use data-driven or multi-touch. If you are spending significant money across many channels, move to data-driven attribution (if your volume supports it) or use a dedicated attribution tool that applies multi-touch models across all your data sources.
Why Platform Attribution Is Structurally Biased
Beyond choosing your own model, there is a deeper problem: every ad platform has a structural incentive to overstate its own contribution. This is not fraud it is self-reported attribution, and it is inherently biased.
How Platforms Claim the Same Conversion
Each platform uses its own attribution by default. When a customer clicks a TikTok ad, then sees a Meta retargeting ad, then clicks a Google search ad and buys Google says Google drove the sale. Meta says Meta drove it. TikTok says TikTok drove it. Every platform claims the sale, and the total attributed conversions far exceed your actual orders.
This duplication is not visible until you look at all channels through a single, independent lens.
The Self-Reporting Bias Problem
Ad platforms make money when you spend money. Their reporting is designed to show you that your ads are working because working ads get continued budget.
Meta's attribution history illustrates the problem. Until recently, Meta's default included a 1-day view window counting users who merely saw an ad as conversions even if they never clicked. That window has since been deprecated, but the structural bias remains: Meta still attributes conversions within its click window using its own matching logic, which can differ significantly from what Shopify records as the referring source.
Independent analytics tools do not have this conflict of interest. A first-party pixel that tracks all channels without a financial stake in which one gets credit shows you a neutral view of what is actually driving conversions.
The Conversion API and Server-Side Tracking
With iOS privacy changes and browser-level restrictions increasingly limiting cookie-based tracking, browser pixels miss a growing share of conversions. The Conversion API (CAPI) fills this gap by sending conversion events directly from your server to ad platforms bypassing browser-based signal loss.
Setting up CAPI for Meta and Google on your Shopify store is one of the highest-ROI technical improvements you can make to attribution data quality. It improves the accuracy of every attribution model you use.
Why You Need Independent Attribution
Independent attribution means tracking conversions from a neutral perspective based on actual customer journeys across all channels, not from within any single ad platform.
What independent tracking reveals that platform data cannot: true channel value (which channels drive discovery versus which close the sale), cross-channel journeys (how customers move between channels before converting), attribution gaps (channels that contribute but never get last-click credit), and platform overstatement (how much each platform inflates its own numbers).
How to Set Up Attribution Tracking on Shopify
Using Shopify's Built-In Marketing Reports
To access marketing attribution: go to Analytics > Reports, select the Marketing category, and choose Customer Orders by Marketing Channel. This report shows orders attributed by your current model.
To change the model: click the Attribution Model dropdown at the top of the report and select the model you want to compare. You can switch between last-click, first-click, linear, and any-click to see how the picture changes. Note: this only changes the view in Shopify it does not change how your ad platforms report their own attribution. The models available depend on your Shopify plan.
What "Direct" Attribution Means in Shopify
In Shopify's reports, "direct" refers to orders where no marketing source can be identified the customer typed your URL, used a bookmark, or came from a non-trackable environment. Direct is often over-counted because any session that loses its UTM parameters (due to a redirect, an app, or a browser that strips referrers) falls into the direct bucket. A significant chunk of what Shopify calls "direct" is actually misattributed paid traffic.
Setting Up UTM Tagging
UTM parameters are the foundation of accurate attribution. Every paid ad, every email campaign, every influencer post should include UTM tags so Shopify can identify the source.
The key parameters: utm_source (the traffic source google, facebook, klaviyo), utm_medium (the channel type cpc, email, social), utm_campaign (the specific campaign name), utm_content (the ad or creative variant), and utm_term (the keyword, for search ads).
Without consistent UTM tagging, Shopify cannot differentiate between paid Meta traffic, organic social shares, and direct visits. The result is attribution data with a large direct share when in reality those are paid visits that lost their source data.
Setting Up Independent Attribution with Polar Analytics
Polar Analytics removes platform bias by tracking every customer journey through a first-party server-side pixel deployed directly from your Shopify store not a browser pixel. This recovers conversion signal that iOS and Safari strip from platform pixels.
On top of that data, Polar offers 10 attribution models every standard model covered in this article (last-click, first-click, linear, time decay, U-shaped) plus proprietary models including Full Impact, which uses Shapley values to calculate each channel's marginal contribution to a sale, and Full Paid Overlap with FB Views, which gives you the closest comparison to Meta's own attribution. Most merchants start with U-shaped (40% first touch, 40% last touch, 20% middle) and compare against Full Impact to understand how credit shifts.
All models run on the same governed semantic layer unifying 40+ sources under 400+ pre-built metric definitions so switching between models is instant, not a rebuild. Compare your blended ROAS (total Shopify revenue ÷ total ad spend) against each platform's self-reported ROAS to see exactly how much they inflate their credit. No warehouse, no data engineer. Connecting your sources takes under 30 minutes; data flows within 24 hours.
Advanced Attribution Strategies
Incrementality Testing
No attribution model tells you what would have happened if you had not run a campaign. Incrementality testing does.
Split your audience into a test group that sees your ads and a control group that does not. The difference in conversion rates tells you how many conversions your ads actually generated beyond what would have happened organically. This is the gold standard for measuring true ad effectiveness because it removes attribution bias entirely.
To run an incrementality test: create a holdout audience (typically 10–20% of your total audience), run your campaign as normal, compare conversion rates between test and control, and calculate the incremental lift.
For brands that want to run incrementality testing without building it themselves, Polar Analytics offers always-on geo-based incrementality testing split geographic markets as test and control to measure causal lift, without requiring audience holdouts that limit your ad delivery.
Marketing Mix Modeling vs. Multi-Touch Attribution
Marketing Mix Modeling (MMM): A statistical approach that analyzes historical data to estimate the impact of marketing channels on sales. Uses regression analysis. Works with aggregated data and is less affected by tracking limitations. Best used quarterly or annually to validate findings and understand long-term channel contribution.
Multi-Touch Attribution (MTA): Tracks individual customer journeys and assigns credit to each channel based on a chosen model. More granular and real-time than MMM but requires accurate cross-channel tracking. Best for day-to-day campaign optimization and channel-level reporting.
Most Shopify stores benefit from combining both: MTA for daily optimization, MMM periodically to validate and understand brand-building channels that MTA might undervalue.
Polar Analytics provides multi-touch attribution natively across all channels, making it a practical foundation for the MTA side of this approach.
Cohort Analysis for Long-Term Attribution
Standard attribution models measure the short-term conversion window. Cohort analysis adds a long-term dimension by tracking groups of customers acquired in the same period over time.
A cohort report might show that customers acquired through Meta in Q4 have higher lifetime value than those acquired through Google even if their initial ROAS looked lower. This is critical for subscription brands and repeat-purchase product lines, where the first purchase is just the start of the relationship.
Track customer acquisition source at the order level, segment cohorts by channel and acquisition month, measure repeat purchase rate and LTV by cohort, and use these insights to set channel-specific LTV targets and adjust ROAS goals accordingly.
Blended ROAS and MER as Complementary Metrics
Regardless of which model you use, two metrics give the most complete picture:
ROAS (Return on Ad Spend): Revenue generated per dollar spent, calculated using a specific attribution model. The same campaign will have a different ROAS under last-click versus first-click.
MER (Marketing Efficiency Ratio): Total revenue ÷ total marketing spend, regardless of attribution. If you made $500,000 in revenue and spent $100,000 on ads, your MER is 5x regardless of which channel gets credit.
Use MER as your north star for overall marketing profitability. Use attribution-modeled ROAS to understand relative channel efficiency. A channel with low last-click ROAS might look completely different under first-click or time decay.
FAQ
Table of contents
Frequently asked questions