

Put every attribution model side by side, run your reallocation under each, and see which budget calls hold no matter how you count and which flip.
Your channel P&L and your next budget move both depend on which attribution model you believe. And you almost certainly look at exactly one, usually whatever the ad platform reports. This builds a spreadsheet that puts every attribution model side by side, runs your reallocation plan under each one, and flags which decisions hold no matter how you count and which flip. The calls that survive all of them are the ones you can move budget on.
A single-attribution decision is a coin flip you cannot see. Change which model drives your recommended split with one dropdown and the whole allocation recalculates. About 20 minutes to build once, then it is your standing pressure-test before any reallocation.
This exact model, simulated and verified end to end on a synthetic ~$20M/yr DTC brand. Here's the spreadsheet 👇
https://docs.google.com/spreadsheets/d/1dURe1ids9_0Mnp0Ga0XqOTu-JDweHgfZNmcY1ibz0Yw/edit?usp=sharing
A spreadsheet with three tabs:
Claude builds it as an Excel file, you open it in Google Drive, and it becomes a live Google Sheet with the dropdown intact.
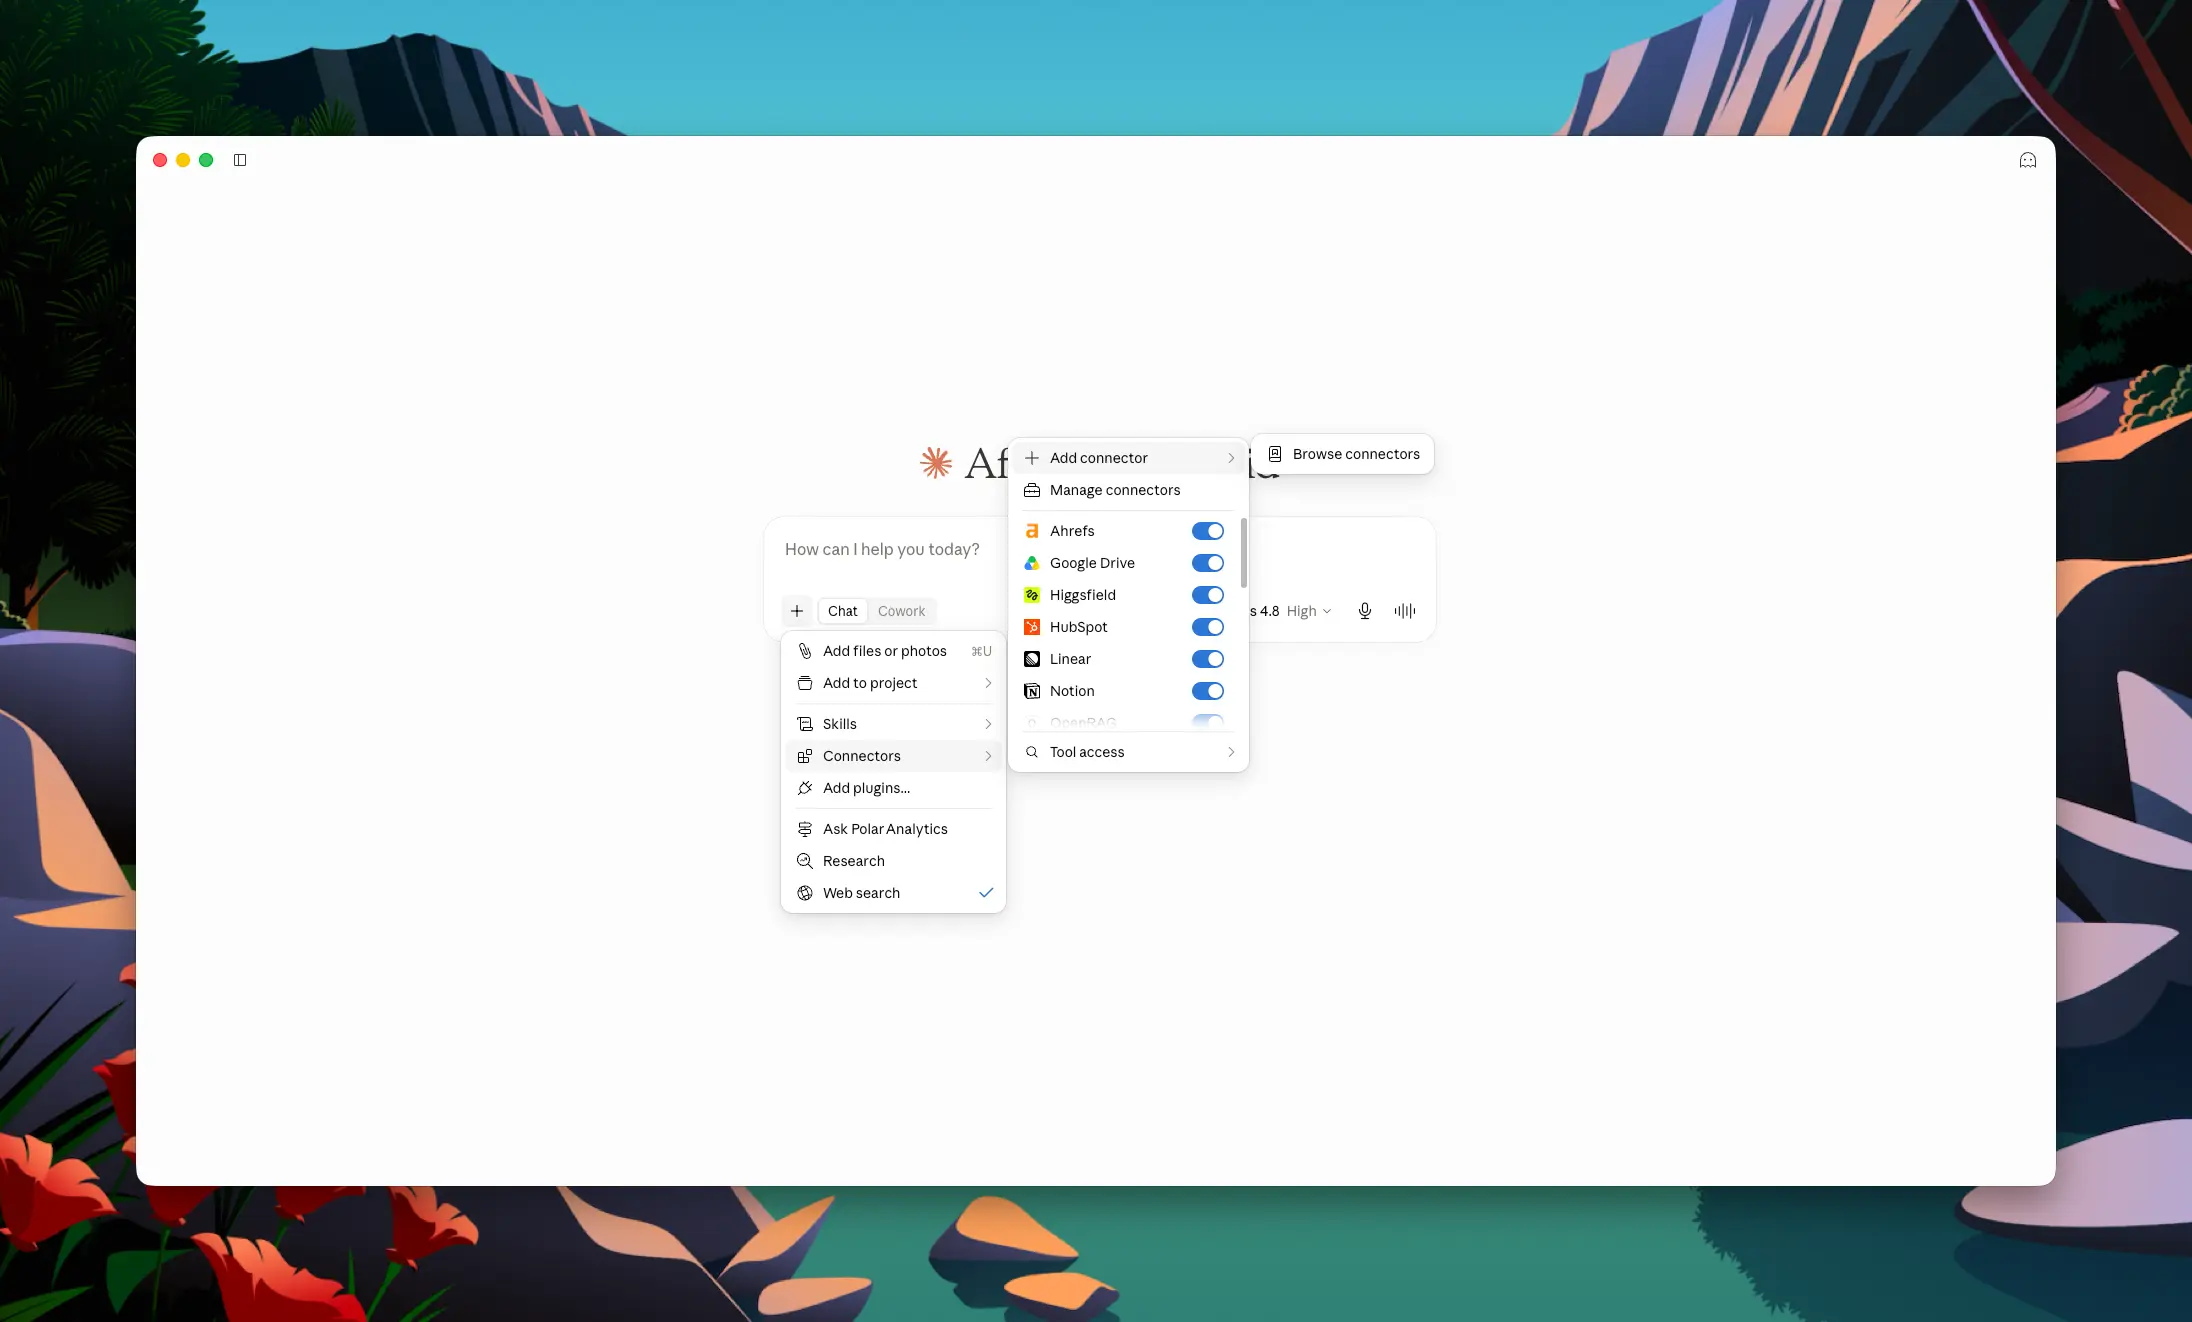
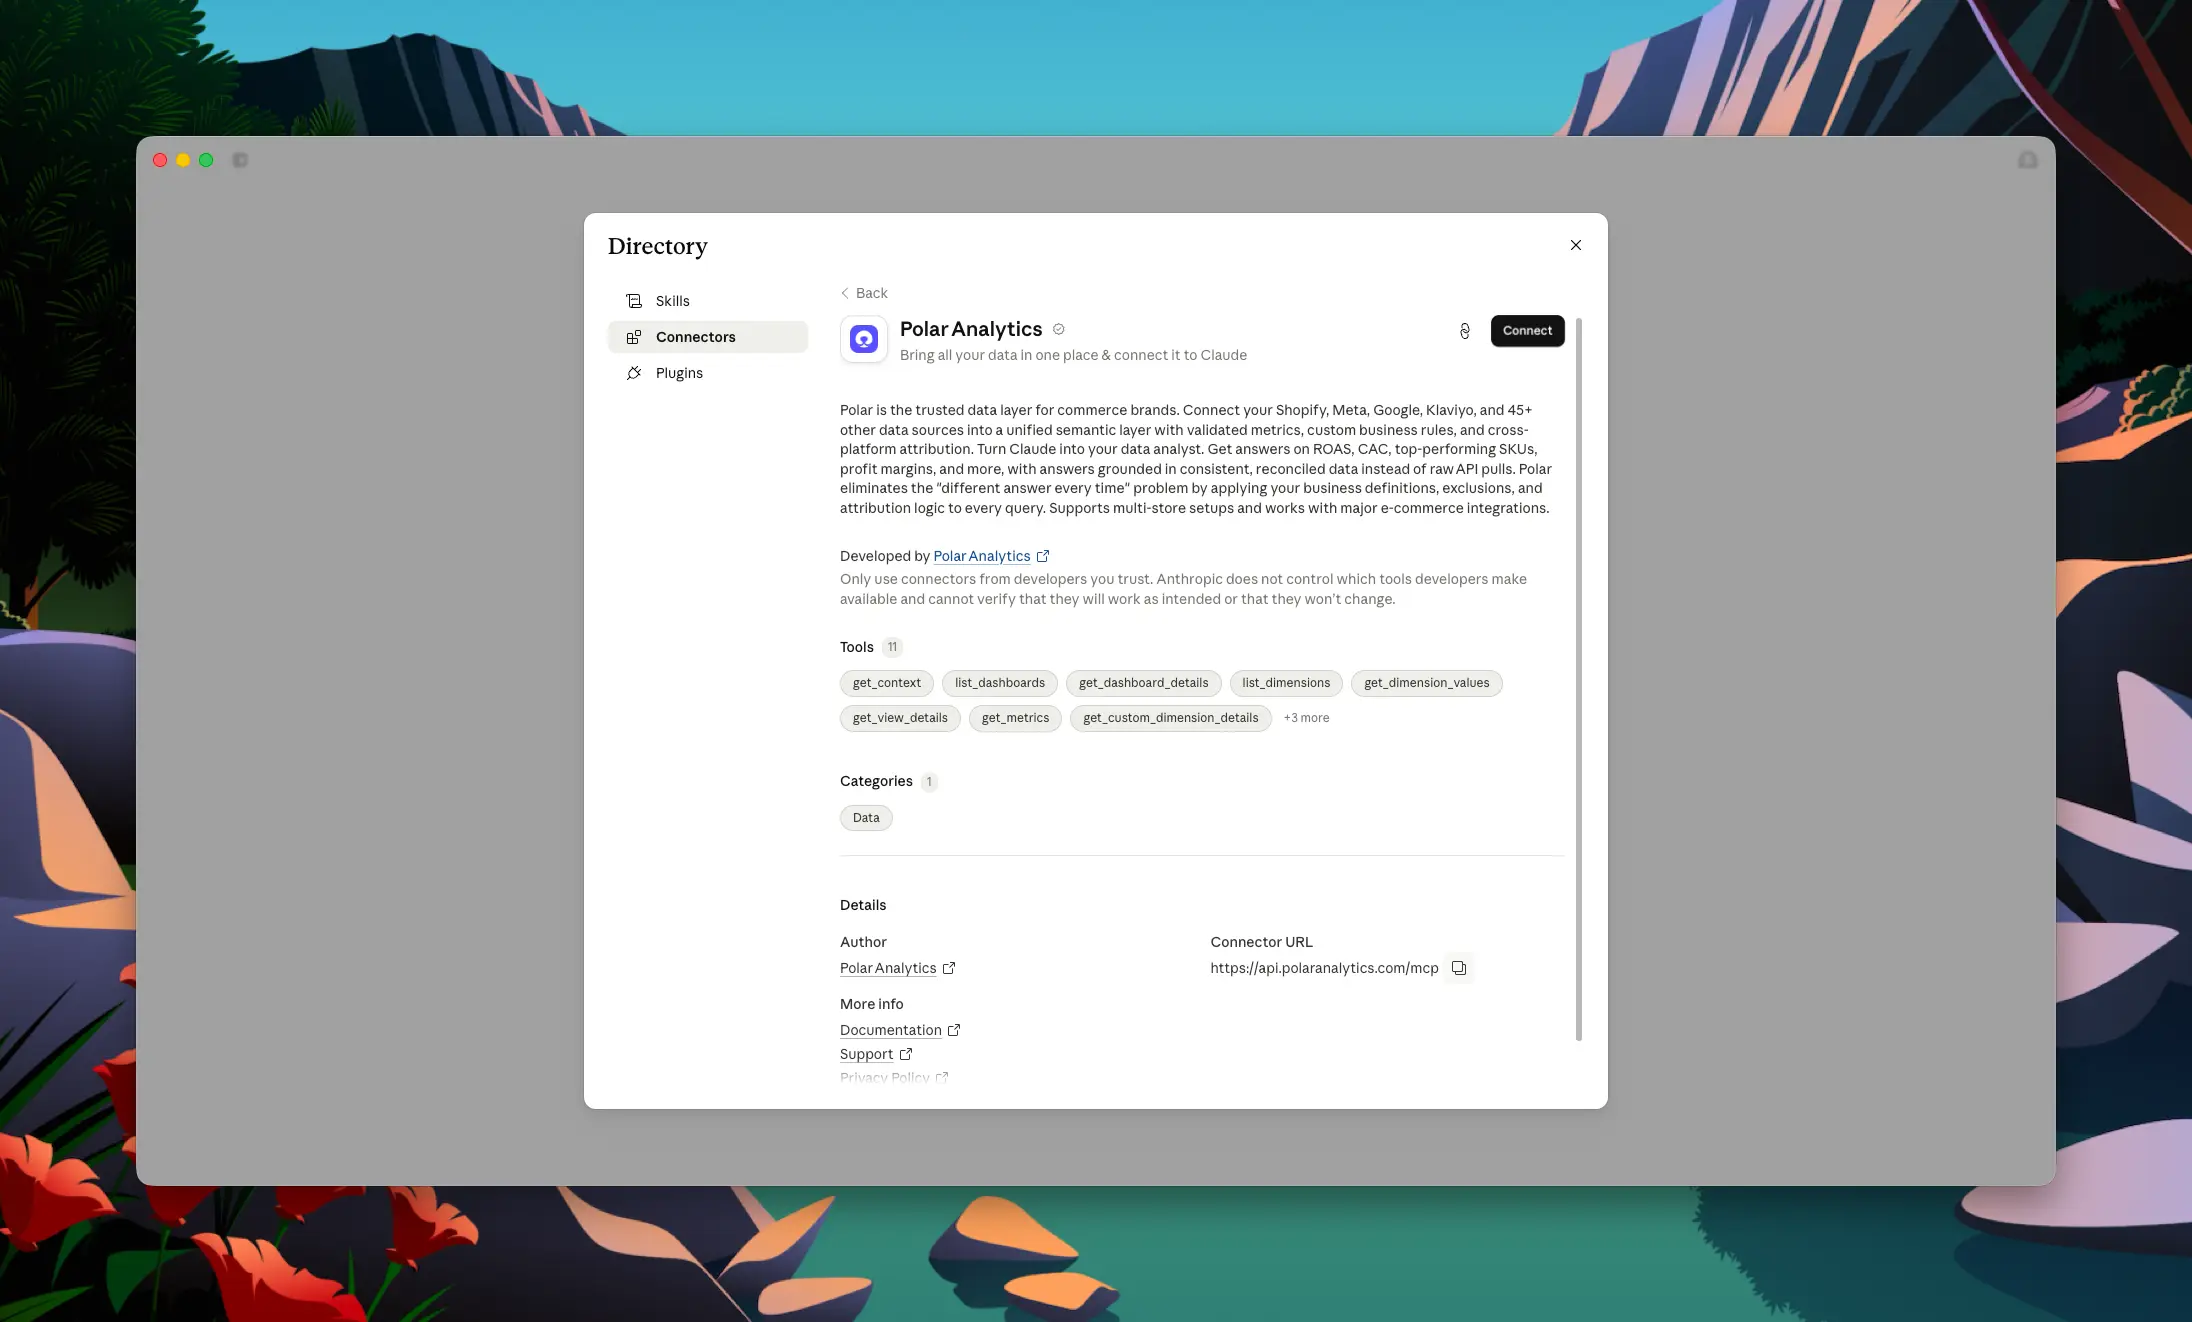
In Claude, open Connectors and enable the Polar MCP, then authenticate. That is the only source this model needs, because Polar already holds your channels and computes every attribution model on one governed dataset.
If you are not on Polar, this is the one use case in the Sheets set that does not have an honest do-it-yourself version. You can only stress-test across attribution models if you have more than one attribution model, and reconstructing even two defensible models from raw rows in a spreadsheet is a project, not a prompt. That gap is the point of this page.

Give Claude this prompt:
Using the Polar MCP, build me an Excel file (.xlsx) called "Attribution Stress Test" with two tabs.
Baseline tab: for the last 30 to 90 days, spend and new customers by channel, and blended and per-channel CAC.
Attribution tab: the same channels down the rows. Across the columns, one block per attribution model Polar exposes (last click, first click, linear, time decay, position based, data-driven, and the rest). For each channel under each model, pull attributed new customers, attributed revenue, and the resulting CAC. Label each column with the model name and note the date range.
Use live formulas for the CAC math so it recalculates if I edit spend. Note that the attributed figures are a point-in-time snapshot from Polar.
Claude writes the grid. Now every channel's CAC is shown the way each model would count it, side by side, which is the comparison almost no one actually looks at.
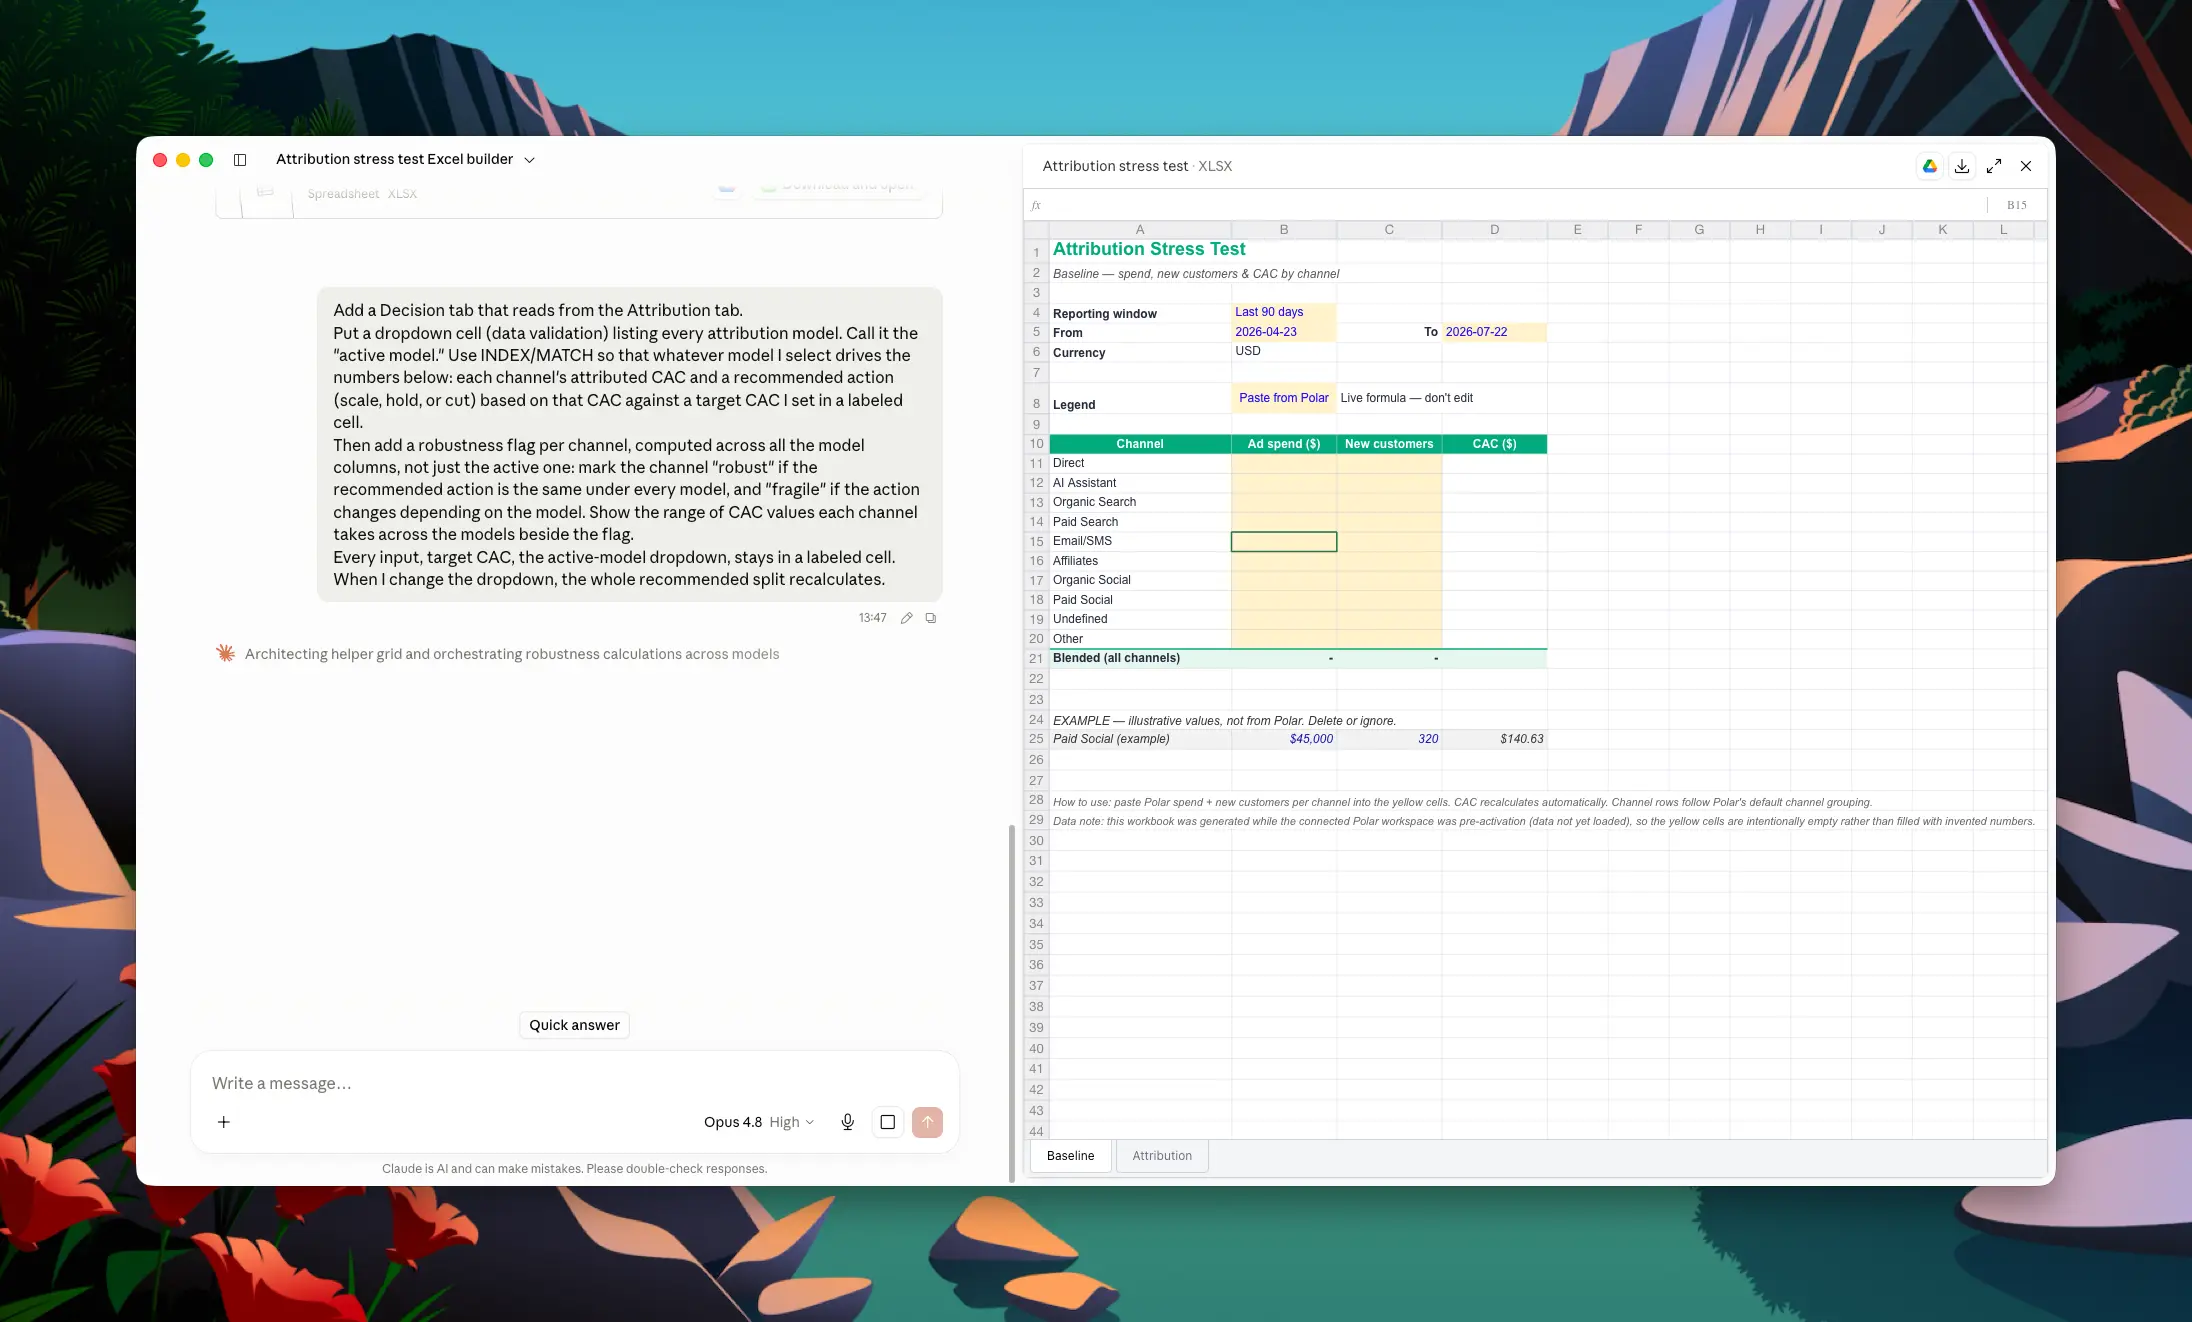
Give Claude this prompt:
Add a Decision tab that reads from the Attribution tab.
Put a dropdown cell (data validation) listing every attribution model. Call it the "active model." Use INDEX/MATCH so that whatever model I select drives the numbers below: each channel's attributed CAC and a recommended action (scale, hold, or cut) based on that CAC against a target CAC I set in a labeled cell.
Then add a robustness flag per channel, computed across all the model columns, not just the active one: mark the channel "robust" if the recommended action is the same under every model, and "fragile" if the action changes depending on the model. Show the range of CAC values each channel takes across the models beside the flag.
Every input, target CAC, the active-model dropdown, stays in a labeled cell. When I change the dropdown, the whole recommended split recalculates.
Now the sheet does the thing the single-model view cannot: it separates the decisions that are stable from the decisions that are an artifact of how you happen to be counting.
Spot-check before you trust it. Toggle the dropdown through two or three models and confirm the recommended split actually changes for the fragile channels and stays put for the robust ones. If nothing moves, the INDEX/MATCH is pointed at the wrong column.
Read the flags first. A channel marked robust, cut it under last click, cut it under data-driven, cut it under everything, is a decision you can make today. A channel marked fragile is telling you the answer depends entirely on a modeling choice you have no strong reason to trust, so it is the wrong place to move real budget on faith.
Toggle the model dropdown and watch the recommended allocation move. The spread between the split under last click and the split under a data-driven model is the size of the bet you are unknowingly making every time you reallocate on one number.
Not optional here. The stress test only exists because Polar computes comparable attribution across models.
For every other model in this set, Polar is an optional upgrade to a spreadsheet you could build alone. Here it is the engine. The stress test only exists because Polar computes true, comparable attribution across models on a semantic layer that defines each channel and metric once, so the columns are actually comparable rather than stitched together from tools that each count differently.
And where the stress test runs out, a fragile channel whose call flips across models and cannot be settled by any of them, Polar is also where you reach for true incrementality testing to answer it for real, instead of picking the model that agrees with what you already wanted to do.
Point Claude at the fragile channels next:
Attribution models are lenses, not truth. The stress test tells you which decisions do not depend on getting that impossible question right, and where a real incrementality test earns its keep.
