

Actuals vs plan, every variance explained, the top three flags and charts, assembled in a sheet before anyone is in on the 1st.
See the worked example - this exact model, simulated and verified end to end on a synthetic ~$20M/yr DTC brand.
Here's the spreadsheet 👇
https://docs.google.com/spreadsheets/d/1VK2q2xMC0UR0Cgv6HdQAzgjdQWciRDwGdkhgWCYG8_8/edit?usp=sharing
A monthly board pack that assembles itself in a Google Sheet: every tab, actuals vs plan across the business, each variance explained in plain English instead of just flagged red, the top three things worth raising written up, and charts laid out. It runs on the 1st before anyone's in, and because it reads from live data it stays current.
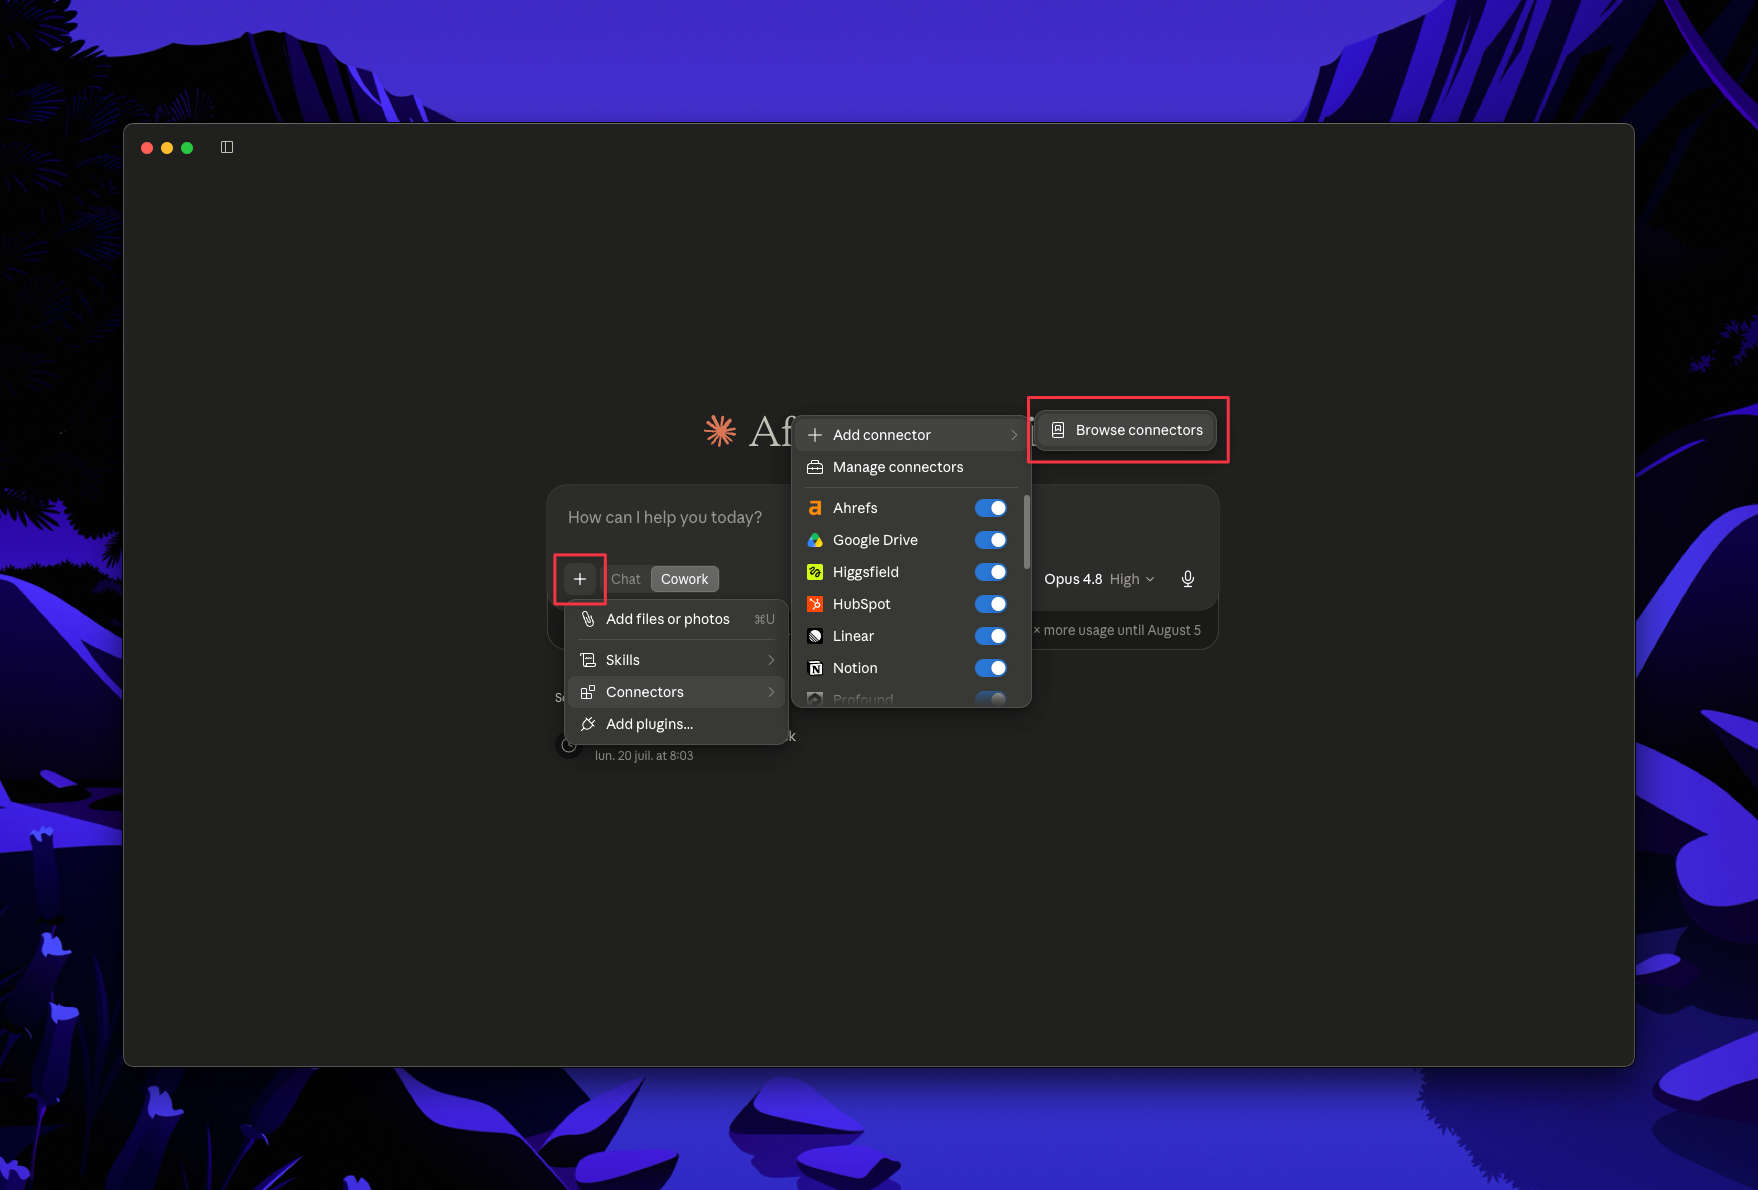
In Claude, open Connectors and enable, then authenticate: Shopify, Klaviyo, Meta Ads, Google Ads, and Google Sheets (so Claude can build the pack in your sheet).
All four data sources have MCP connectors, so Claude reads them directly. For a channel or system without one (TikTok Shop, Amazon, a 3PL, your accounting tool), bridge it with the Zapier MCP, pipe it into a warehouse and connect that MCP, or drop a CSV in each time. A board pack pulls from more corners of the business than a weekly report, so map these before you build.
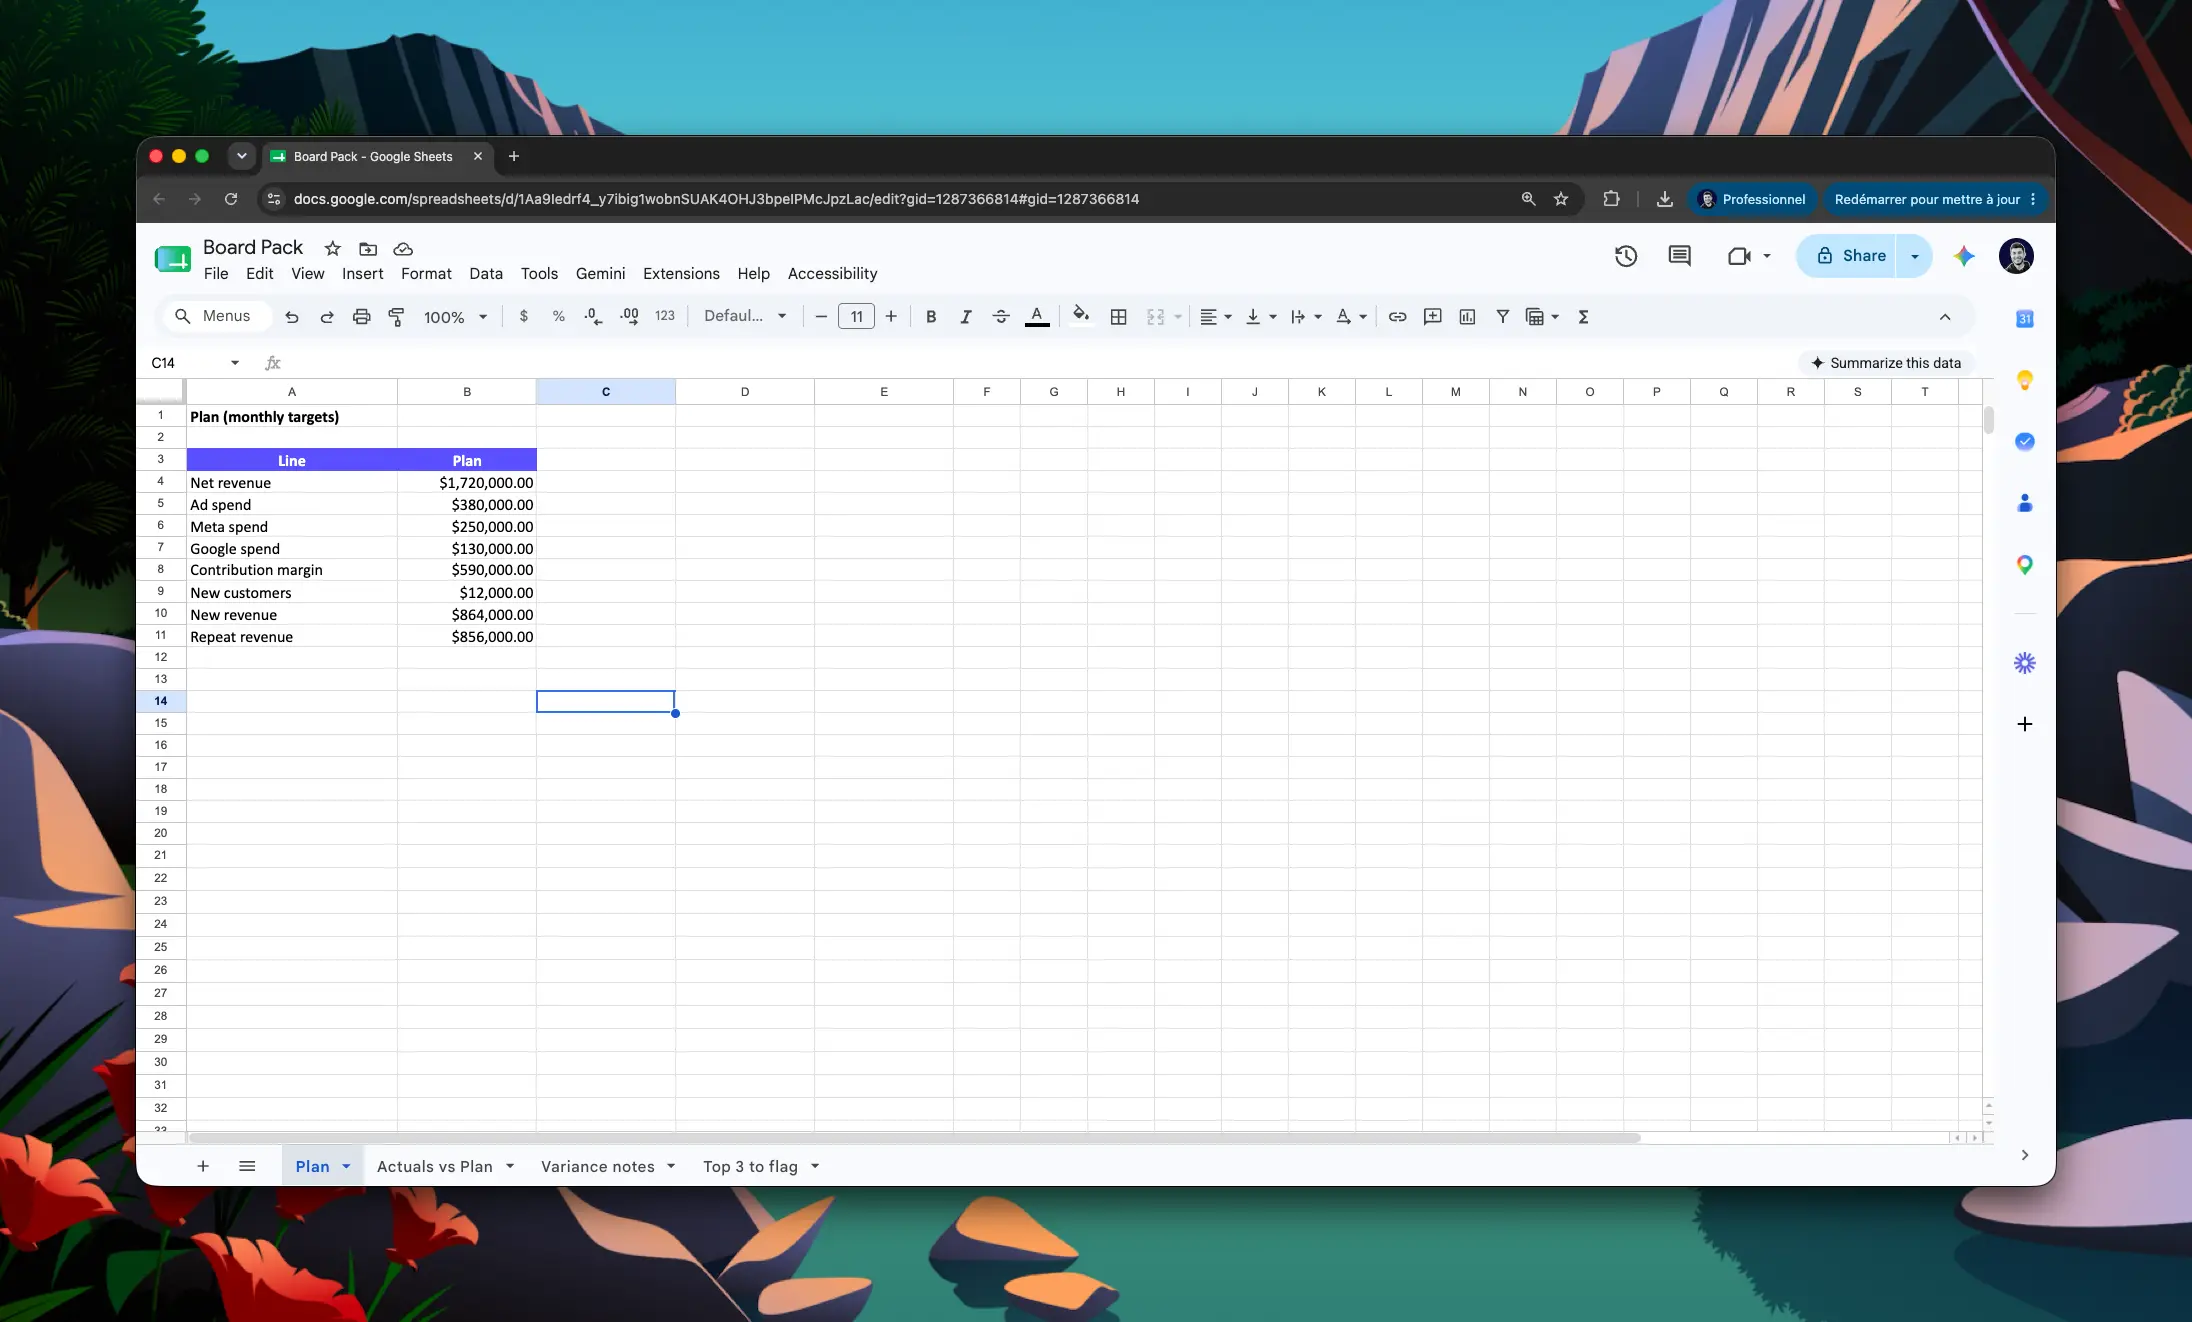
Actuals vs plan needs a plan. Add a Plan tab with your monthly targets by line: revenue, spend by channel, contribution margin, new customers, whatever the board sees. If you keep targets elsewhere, paste them in or point Claude at them.
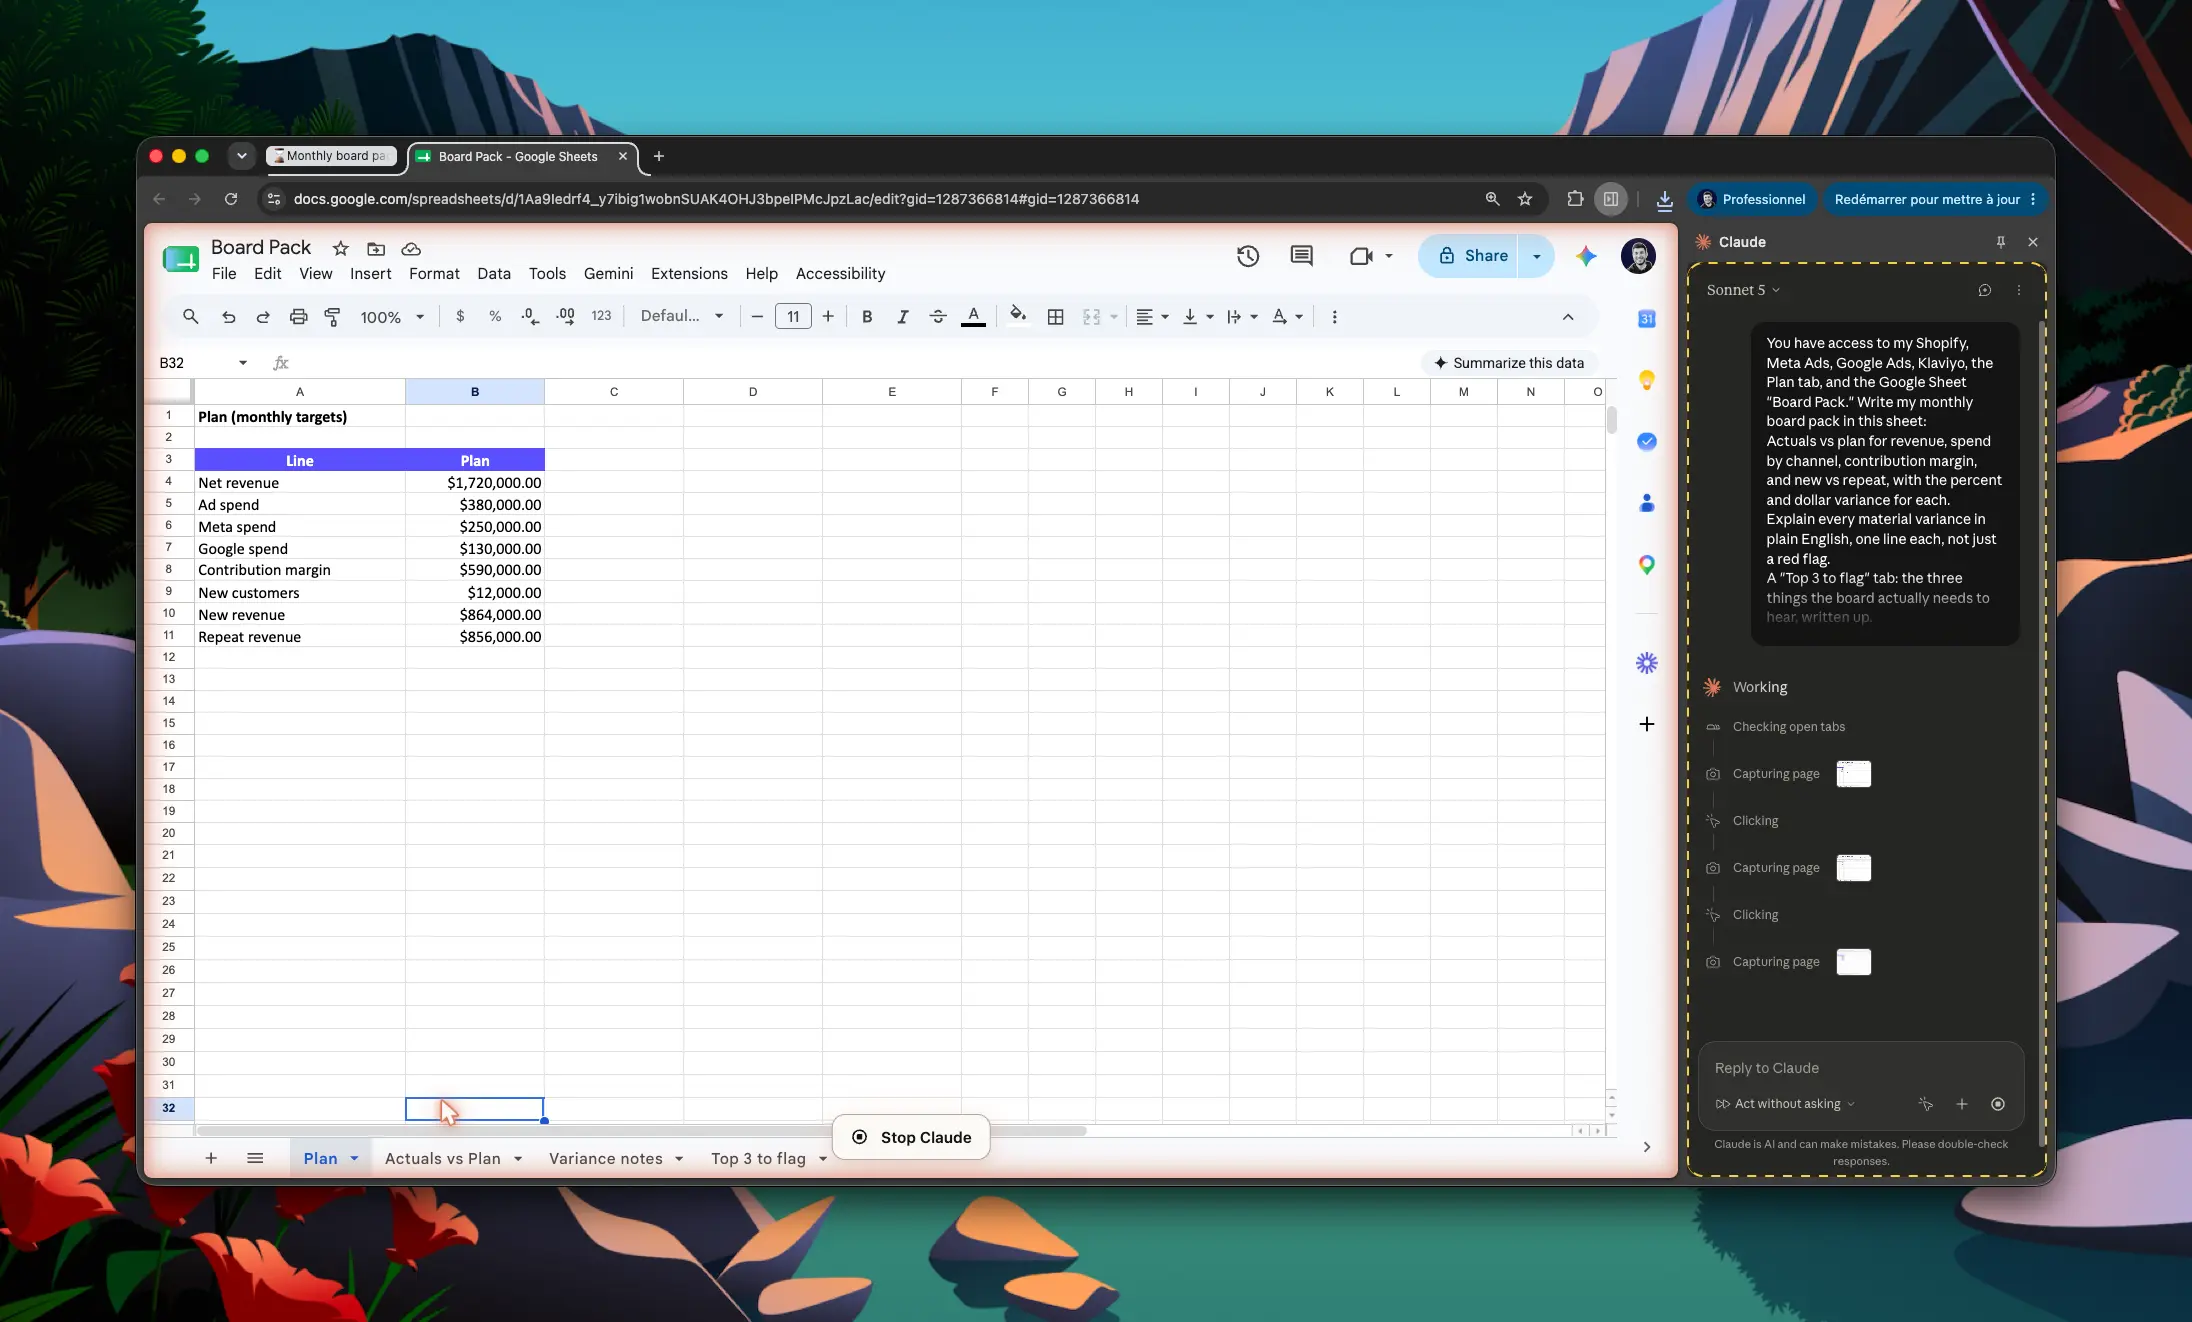
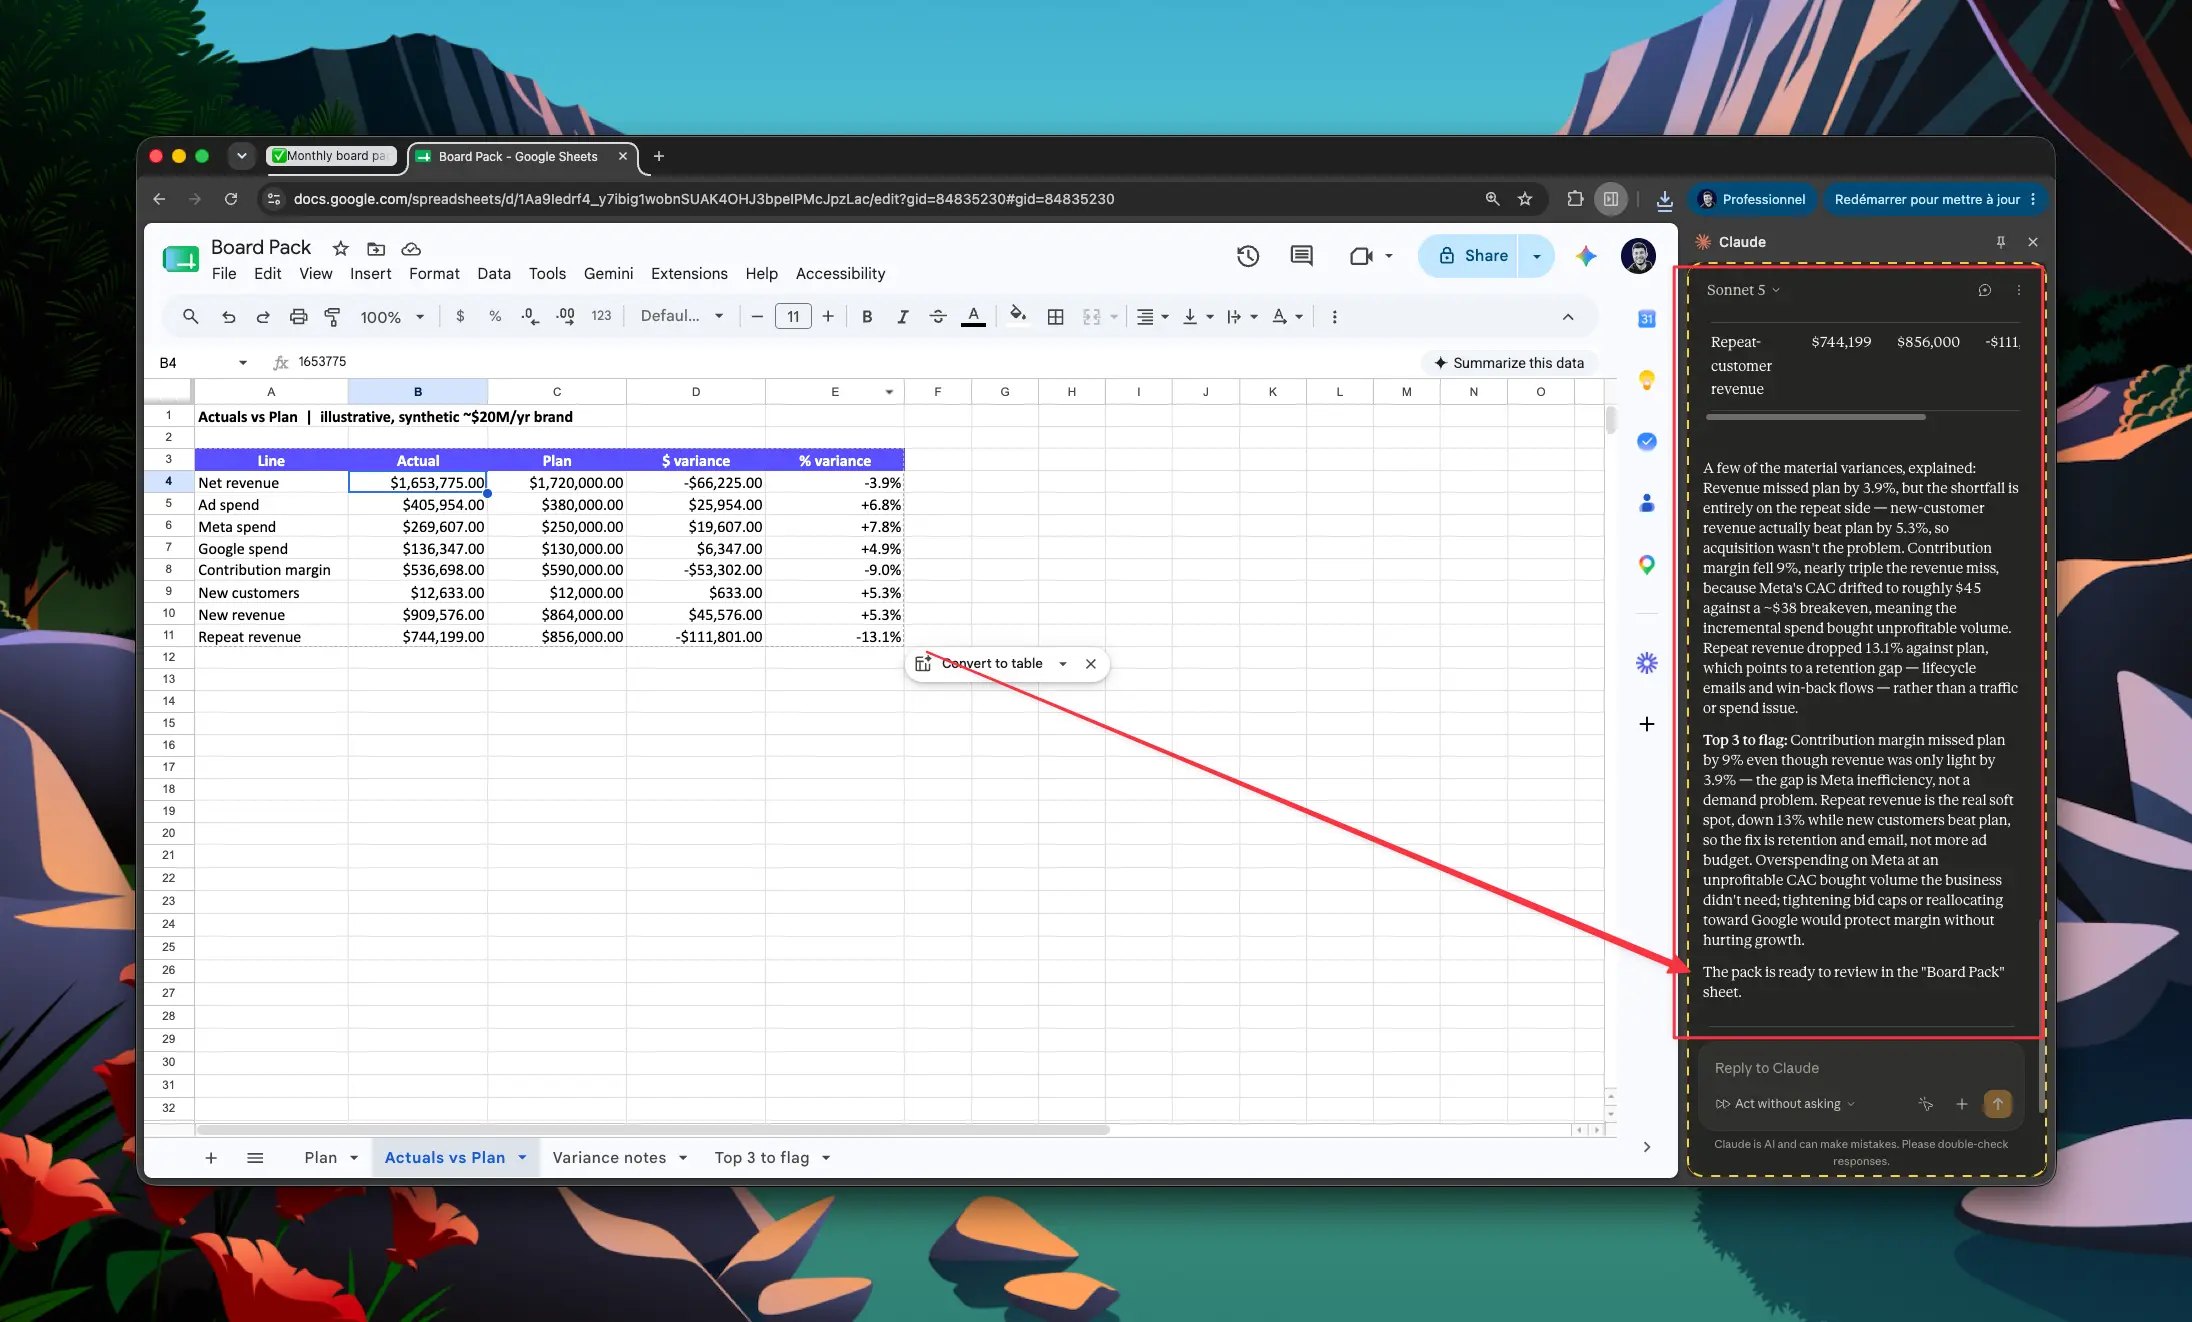
Open your "Board Pack" sheet and give Claude this prompt:
You have access to my Shopify, Meta Ads, Google Ads, Klaviyo, the Plan tab, and the Google Sheet "Board Pack." Write my monthly board pack in this sheet:
Actuals vs plan for revenue, spend by channel, contribution margin, and new vs repeat, with the percent and dollar variance for each.
Explain every material variance in plain English, one line each, not just a red flag.
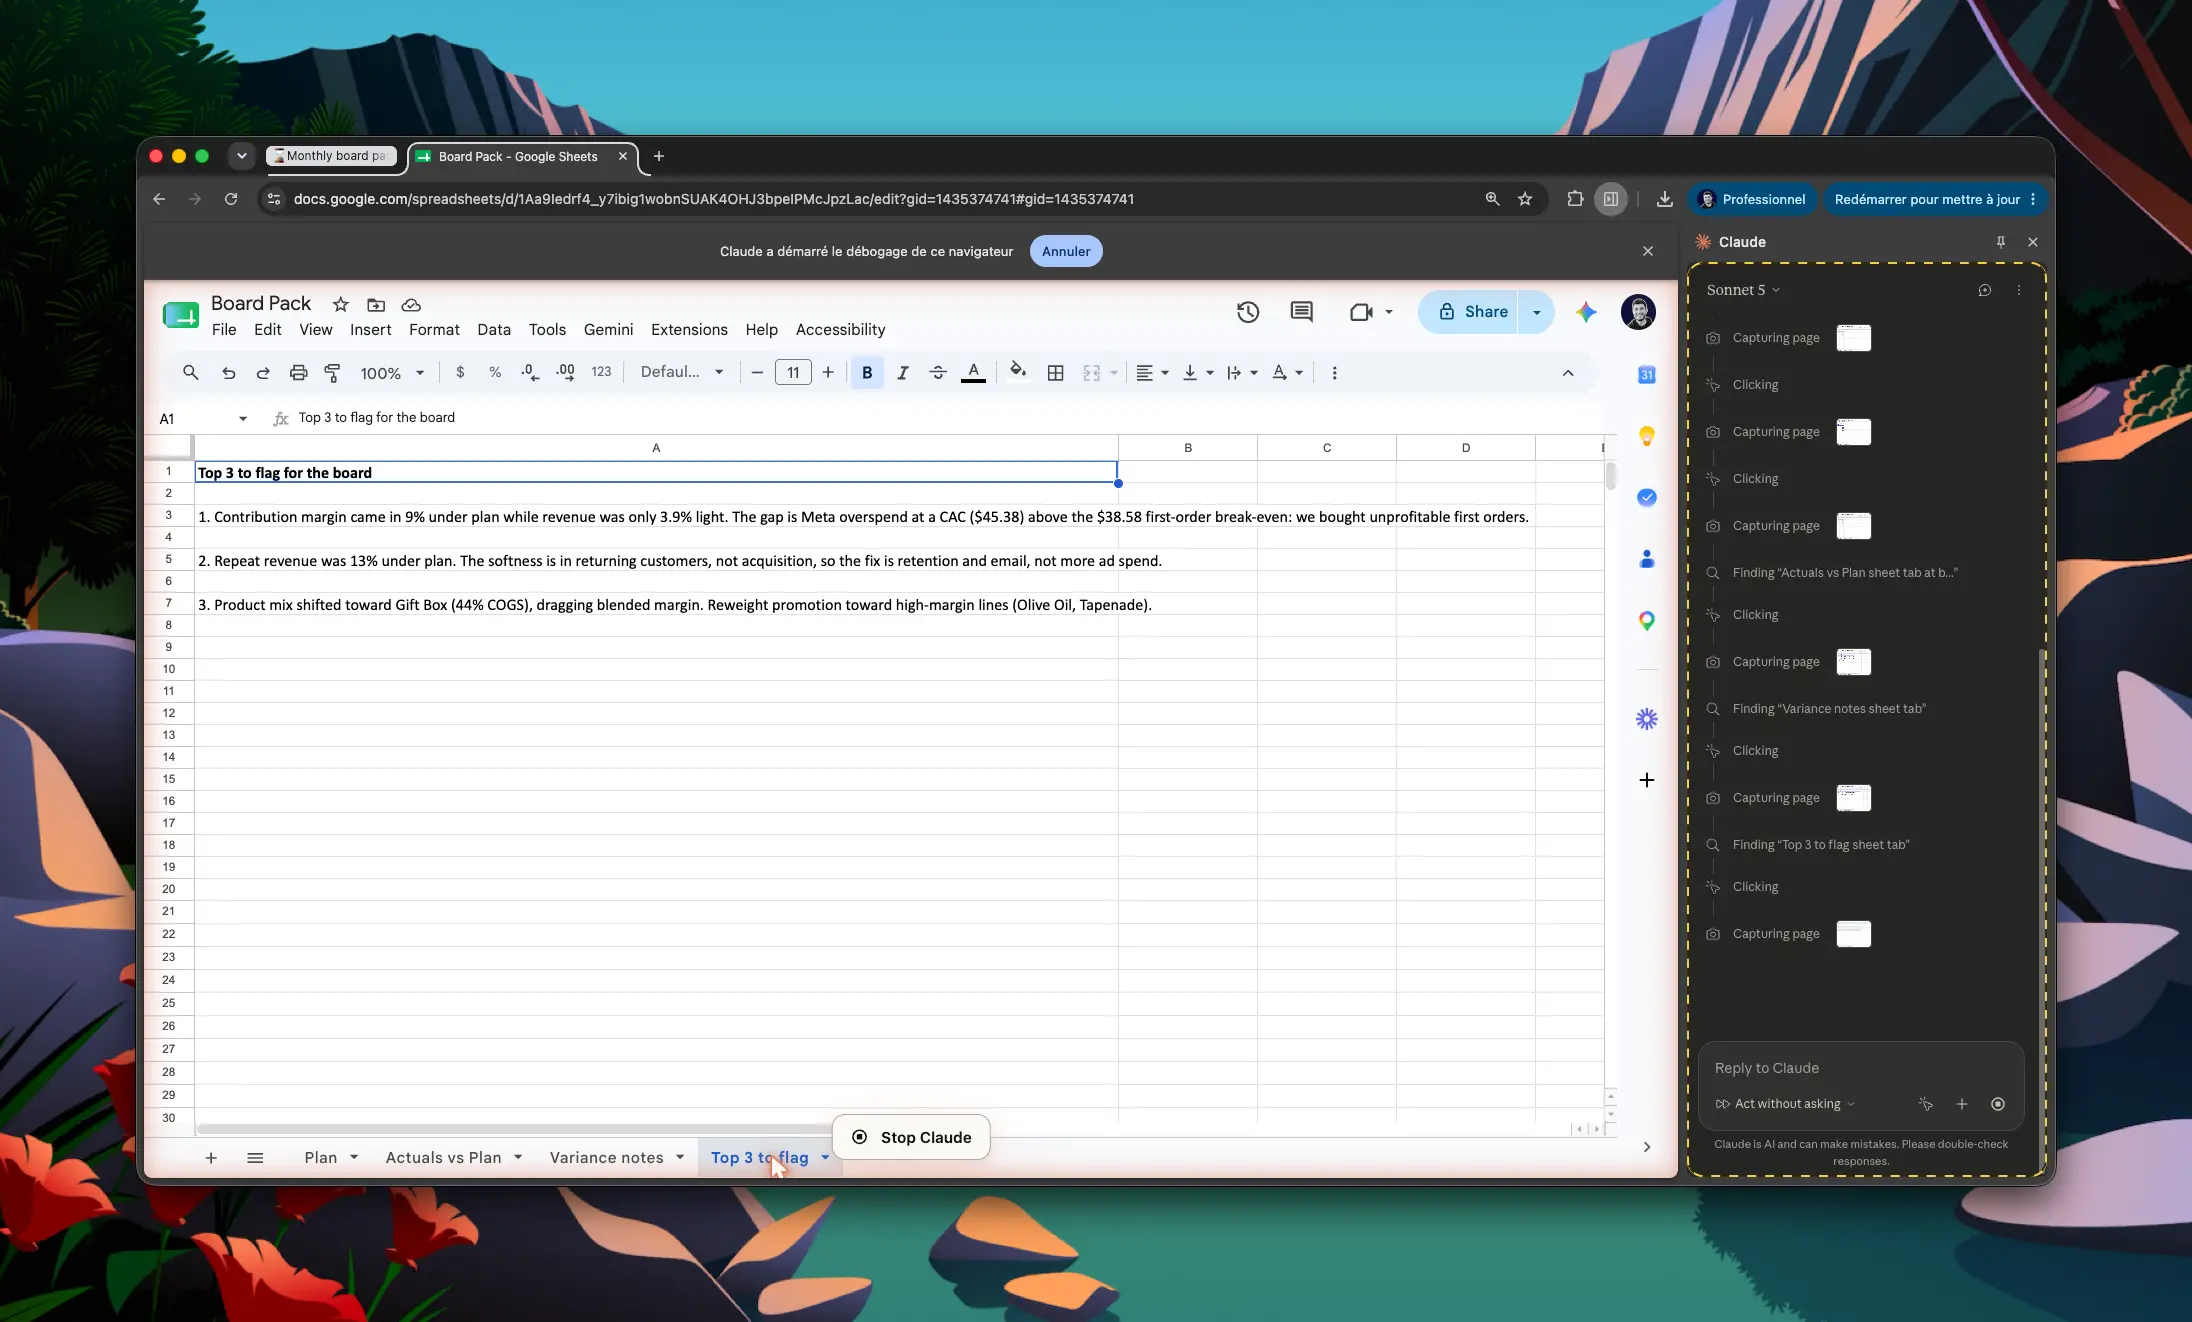
A "Top 3 to flag" tab: the three things the board actually needs to hear, written up.
Charts for the headline trends. Use live formulas, label the period, and format it so it reads clean.
Claude builds every tab, writes the variance commentary, drafts the three flags, and lays out the charts.
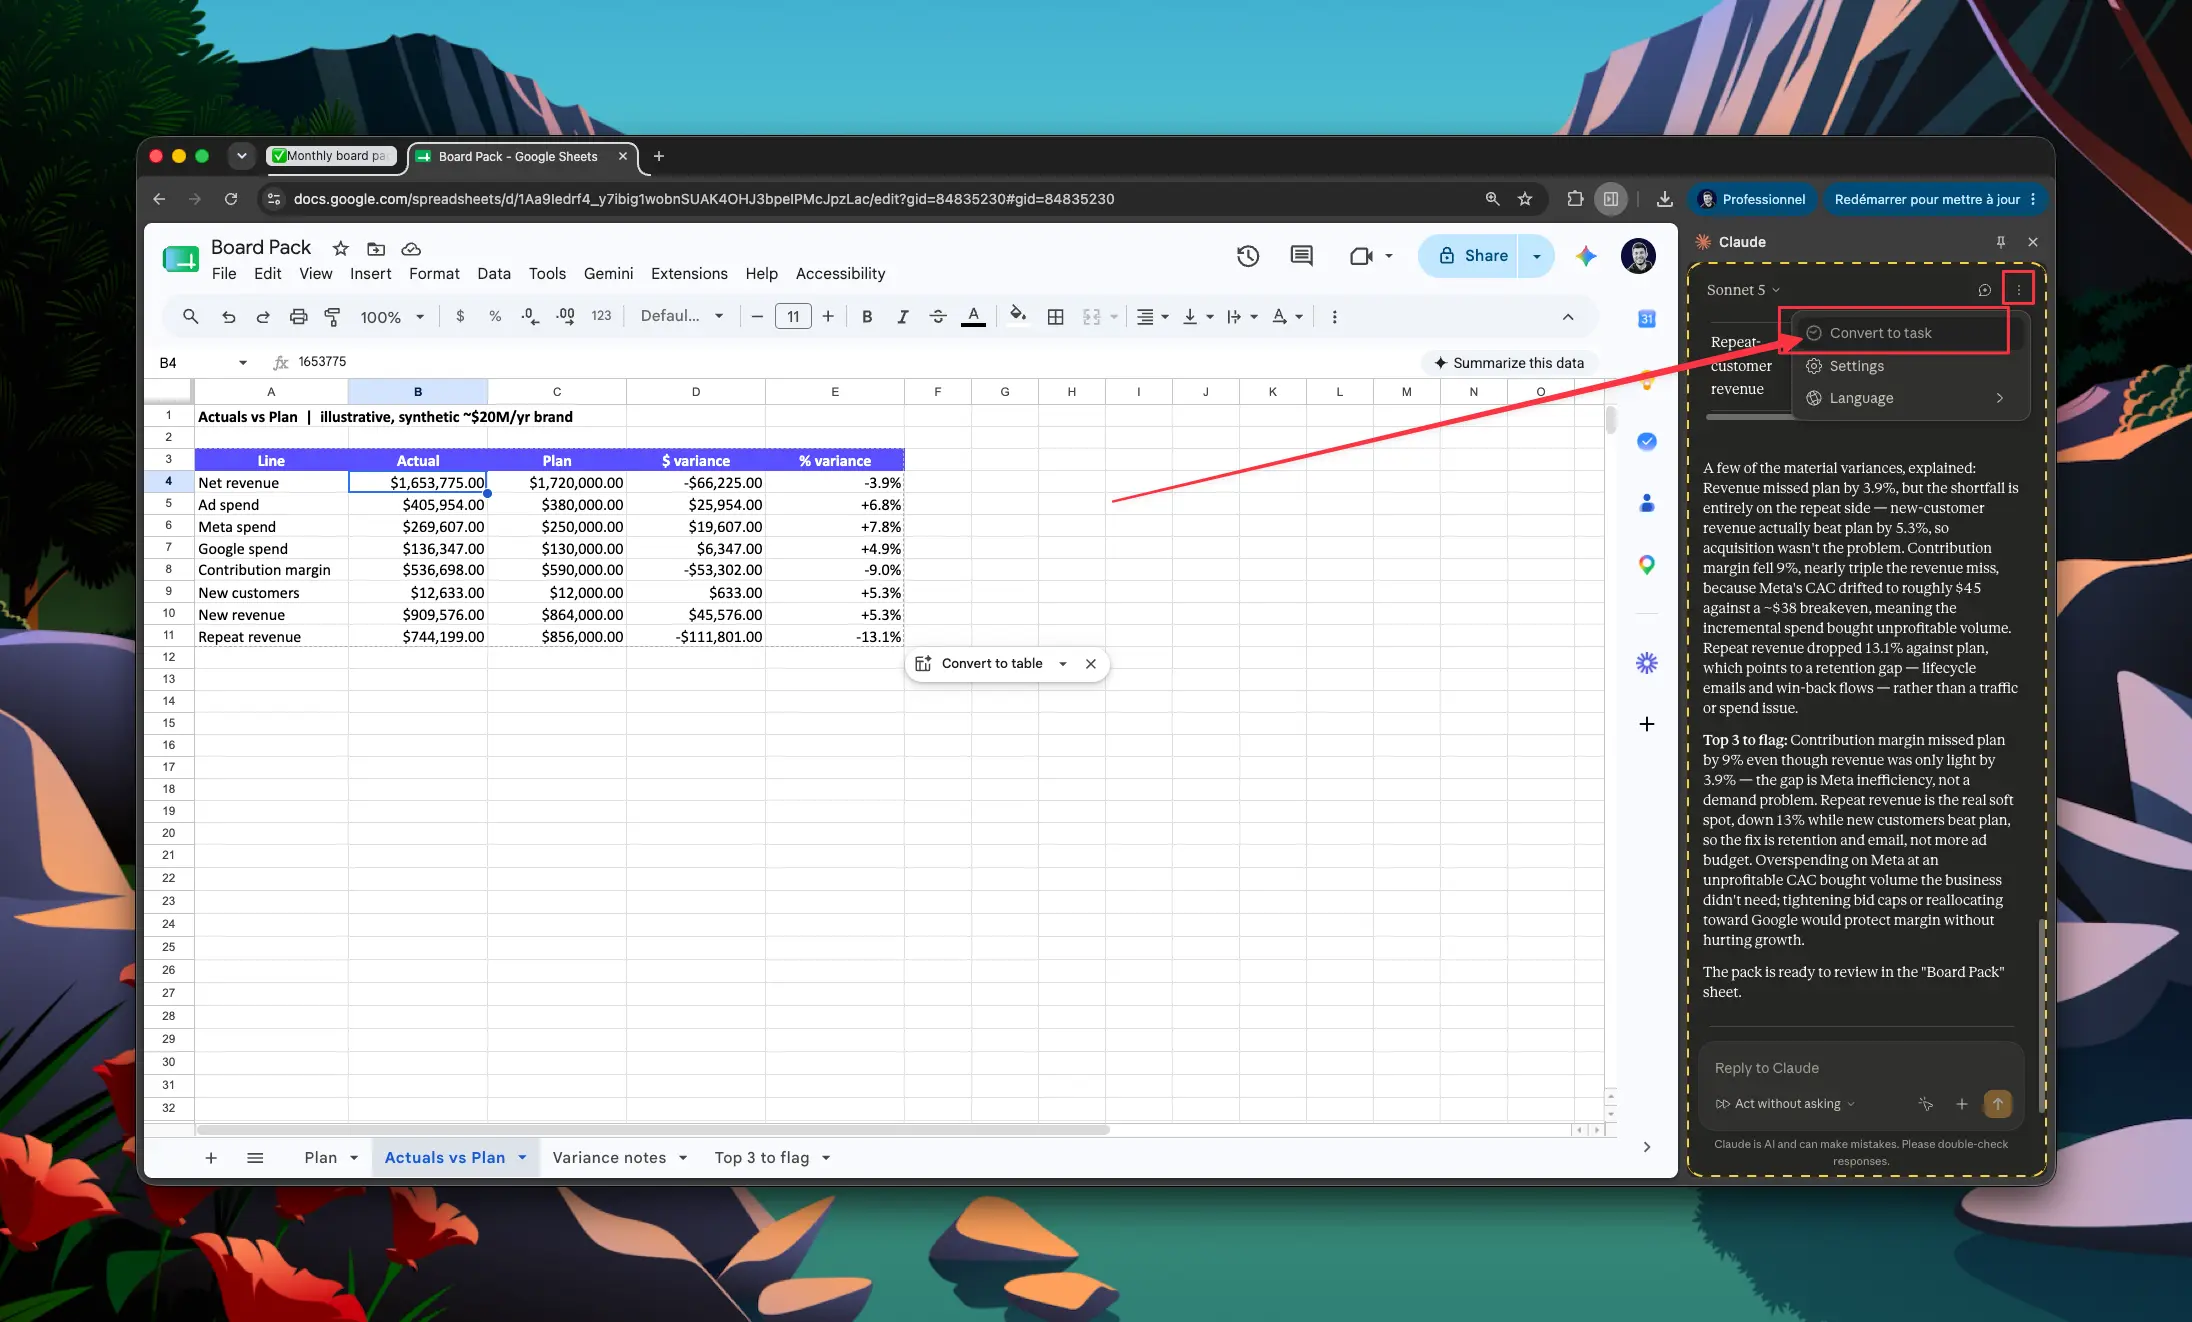
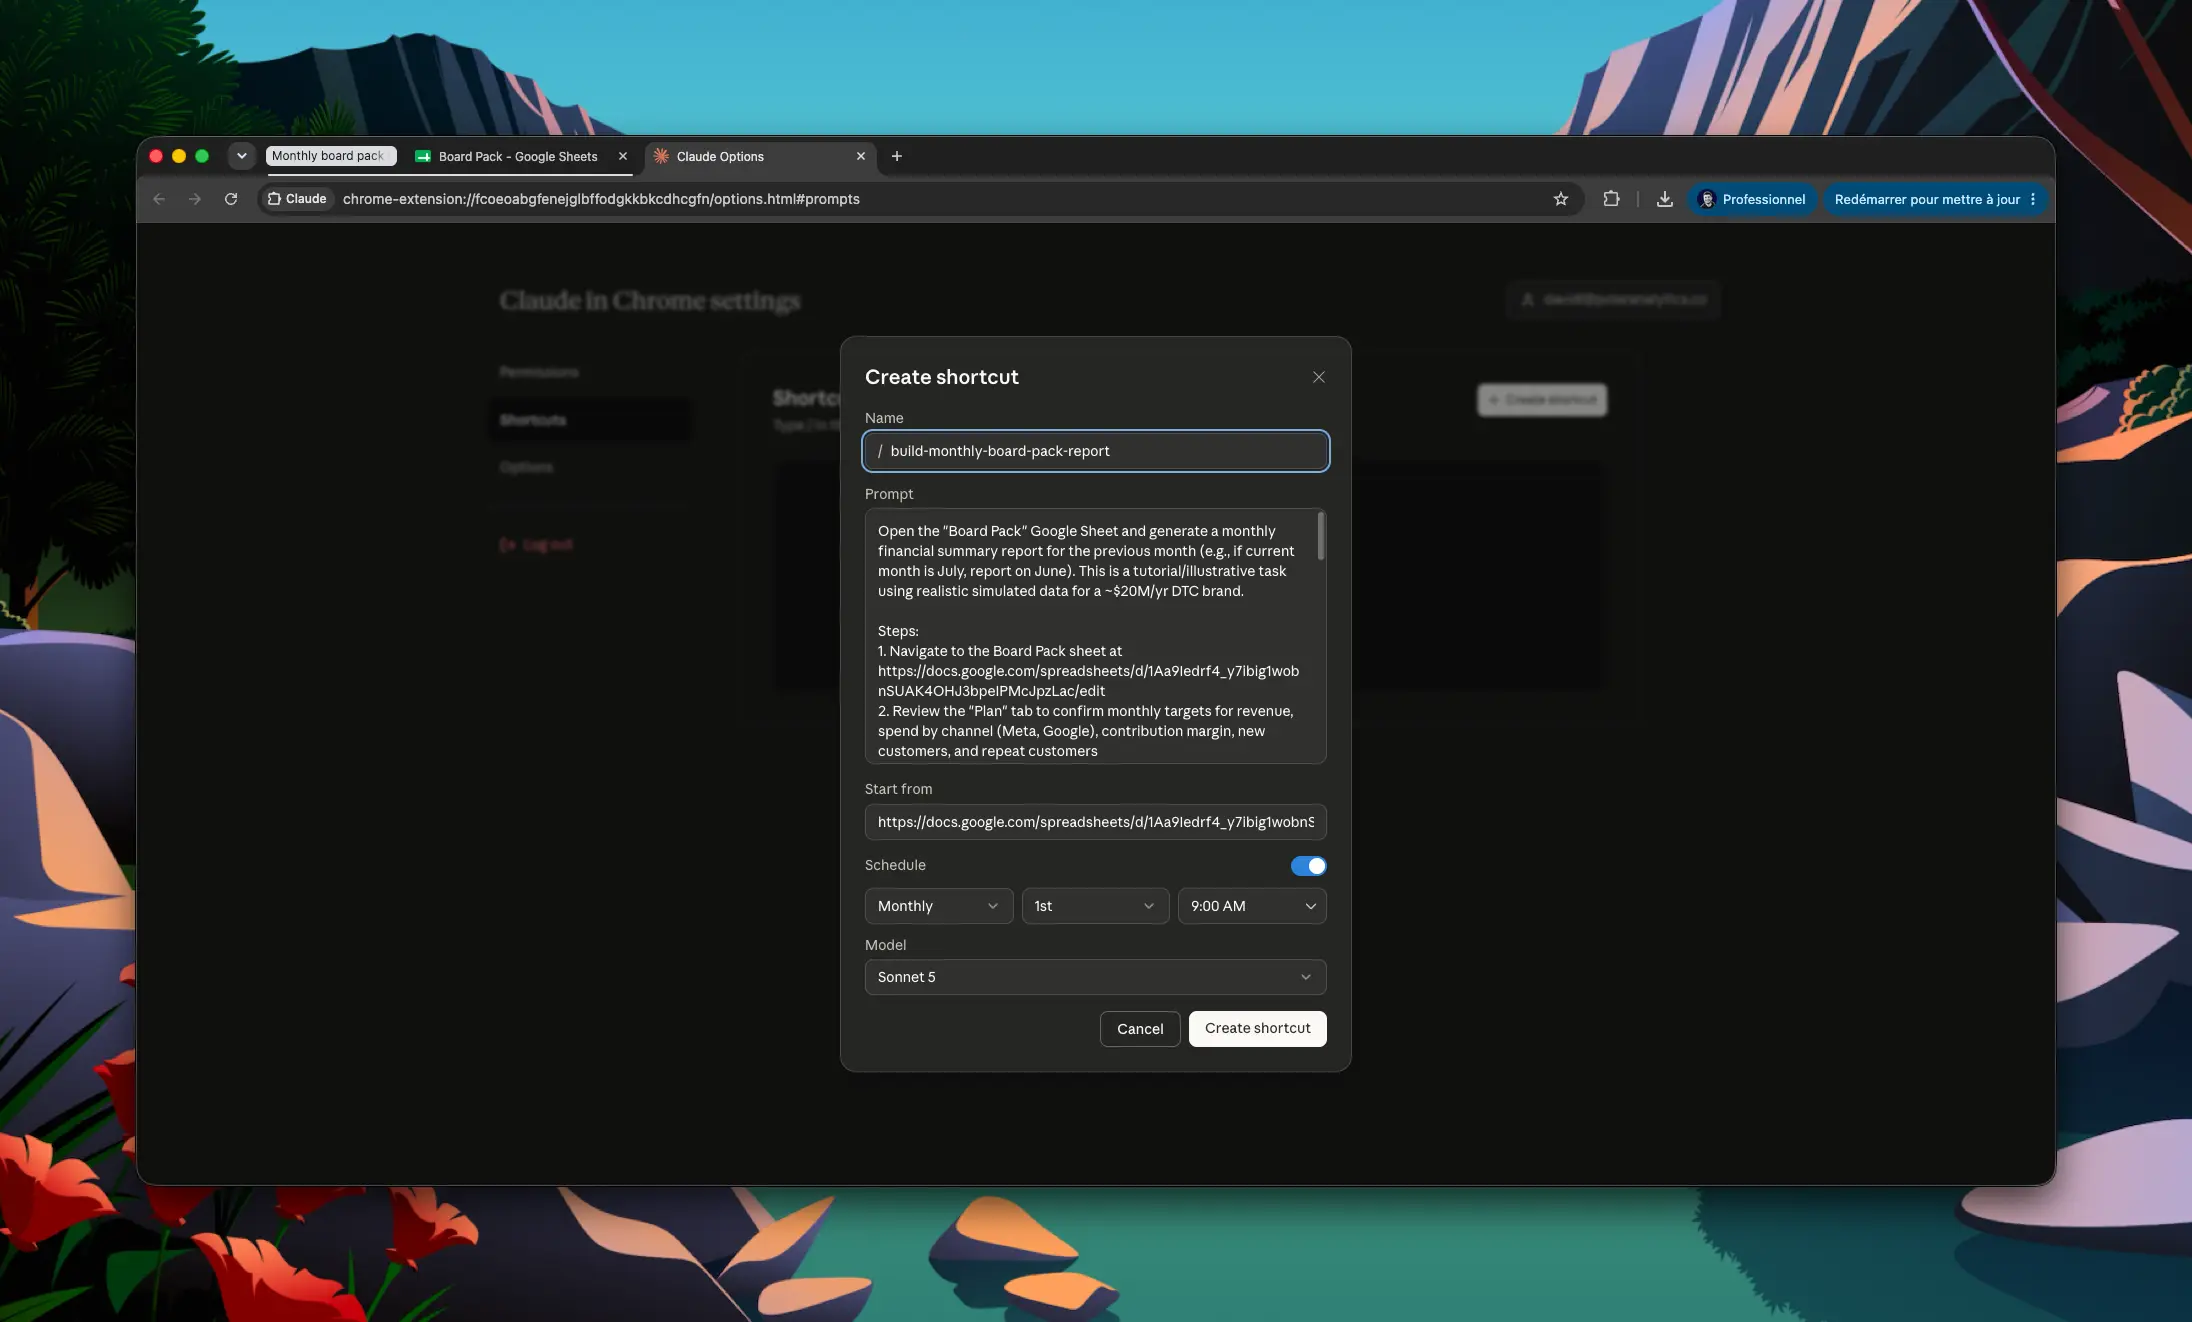
In Claude Cowork, save the prompt as a recurring task on the 1st of each month that refreshes the pack from live data and sends you the link. The pack is waiting before anyone's in.
Open the sheet and read it like a reviewer, not a builder. Check the variance commentary and the three flags, adjust the wording where you would say it differently, and it is ready for the room. The lost weekend is gone; your time goes to the story, not the assembly.
Optional, but for a board pack this is the part that decides whether the room trusts it.
A board pack has to be right, and right means every metric defined once. Run the version above and Claude is joining six tools that each count revenue, spend, and "new vs repeat" a little differently. It works, right up until someone in the room finds two different net-sales numbers and stops trusting the whole pack.
Polar removes that risk. It consolidates the whole business (marketing, sales, finance, operations) into one governed source with each metric defined once, and hands Claude a single clean feed. That is what makes a pack Claude writes something you can stand behind in the room.
Enable the Polar MCP and swap Step 3's data sources for:
With Polar you can also rebuild the pack under any of its 10 attribution models if the board wants to see the picture a different way.
