

The CAC at which each channel's contribution hits zero, one row per channel, with the headroom left before it starts losing money on every order.
You set a target CAC for each channel and manage to it. But a target is a goal you picked. The number that actually decides whether a channel makes money is the CAC at which its contribution hits zero, and most brands have never calculated it. This builds that ceiling into a spreadsheet you own, one row per channel, and shows you exactly how much headroom you have left before a channel starts losing money on every order.
A break-even CAC is not a target. It is the line. Pay less than it and the channel adds contribution margin; pay more and every new customer costs you money. Change one cost input, COGS, shipping, return rate, fees, and every channel's ceiling recomputes in front of you. About 20 minutes to build once, then it is yours to re-run whenever your costs move.
This exact model, simulated and verified end to end on a synthetic ~$20M/yr DTC brand. Here's the spreadsheet 👇
https://docs.google.com/spreadsheets/d/1utzSugazCJoP8tHWJDlQwJAvISf_ZkWQKvfozcWQN2U/edit?usp=sharing
A spreadsheet with two tabs:
Claude builds it as an Excel file, you open it in Google Drive, and it becomes a live Google Sheet. Change any cost input and the whole thing recalculates.
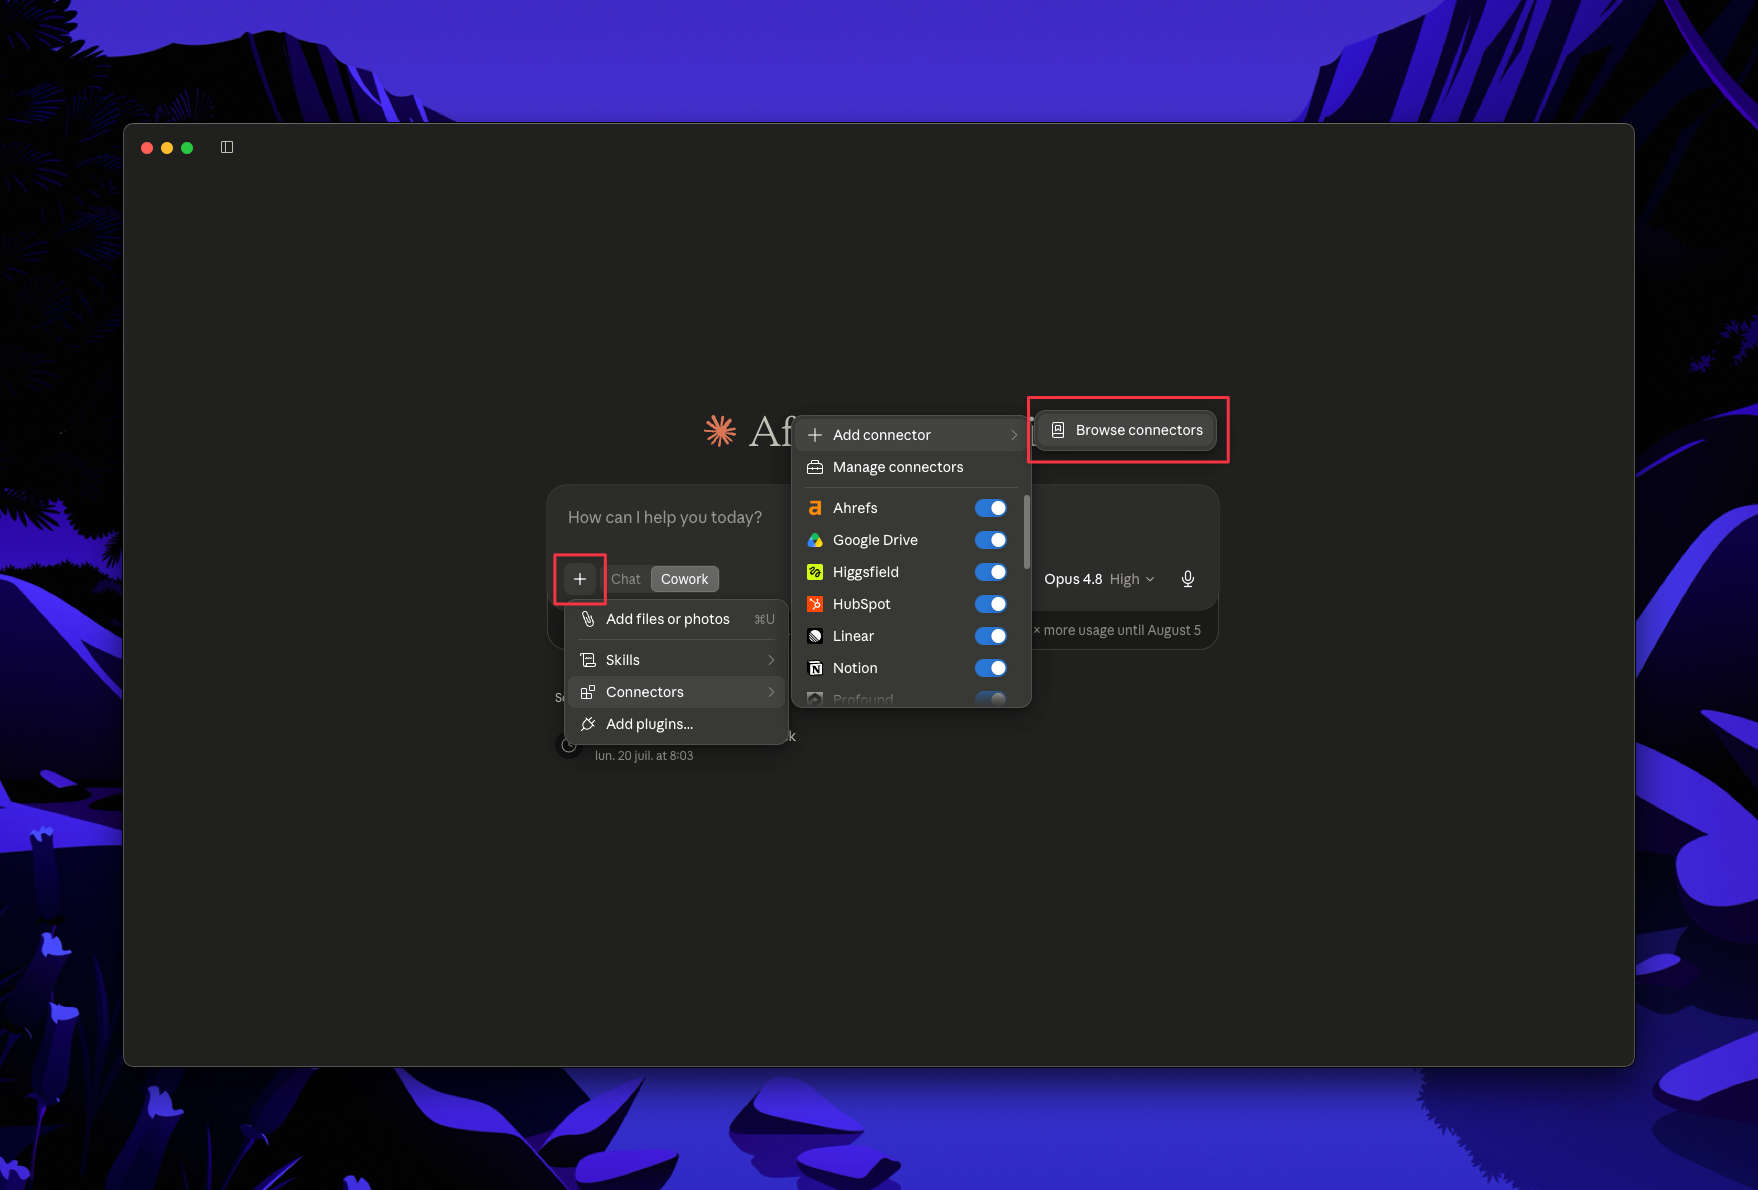
In Claude, open Connectors and connect the sources that feed the baseline. Shopify and Klaviyo are first-party connectors, enable and authenticate in a couple of clicks. Meta Ads and Google Ads connect through their own MCP servers, added as custom connectors, or through a bundled connector (for example Windsor.ai or Adspirer) if you would rather do it in one pass.
The ceiling is only as honest as the margin behind it, so getting your cost inputs right matters more here than the connector plumbing.

Give Claude this prompt:
You have access to my Shopify, Meta Ads, Google Ads, and Klaviyo. Build me an Excel file (.xlsx) called "Break-even CAC" with a Baseline tab from the last 3 to 6 months of actuals, as a monthly run-rate:
- Net revenue by channel and blended
- Ad spend and new customers by channel, and per-channel CAC
- AOV and repeat share (repeat orders as a share of total)
- My cost assumptions in labeled input cells: COGS percent, shipping percent, return rate, and payment or platform fee percent
Use live spreadsheet formulas throughout, not pasted values, so the sheet recalculates when I change an input. Label the date range and note which numbers are a point-in-time snapshot from my sources.
Download it, open it in Google Drive, and it converts to a Google Sheet with the formulas intact. Eyeball the totals against a number you already trust before you build on it.
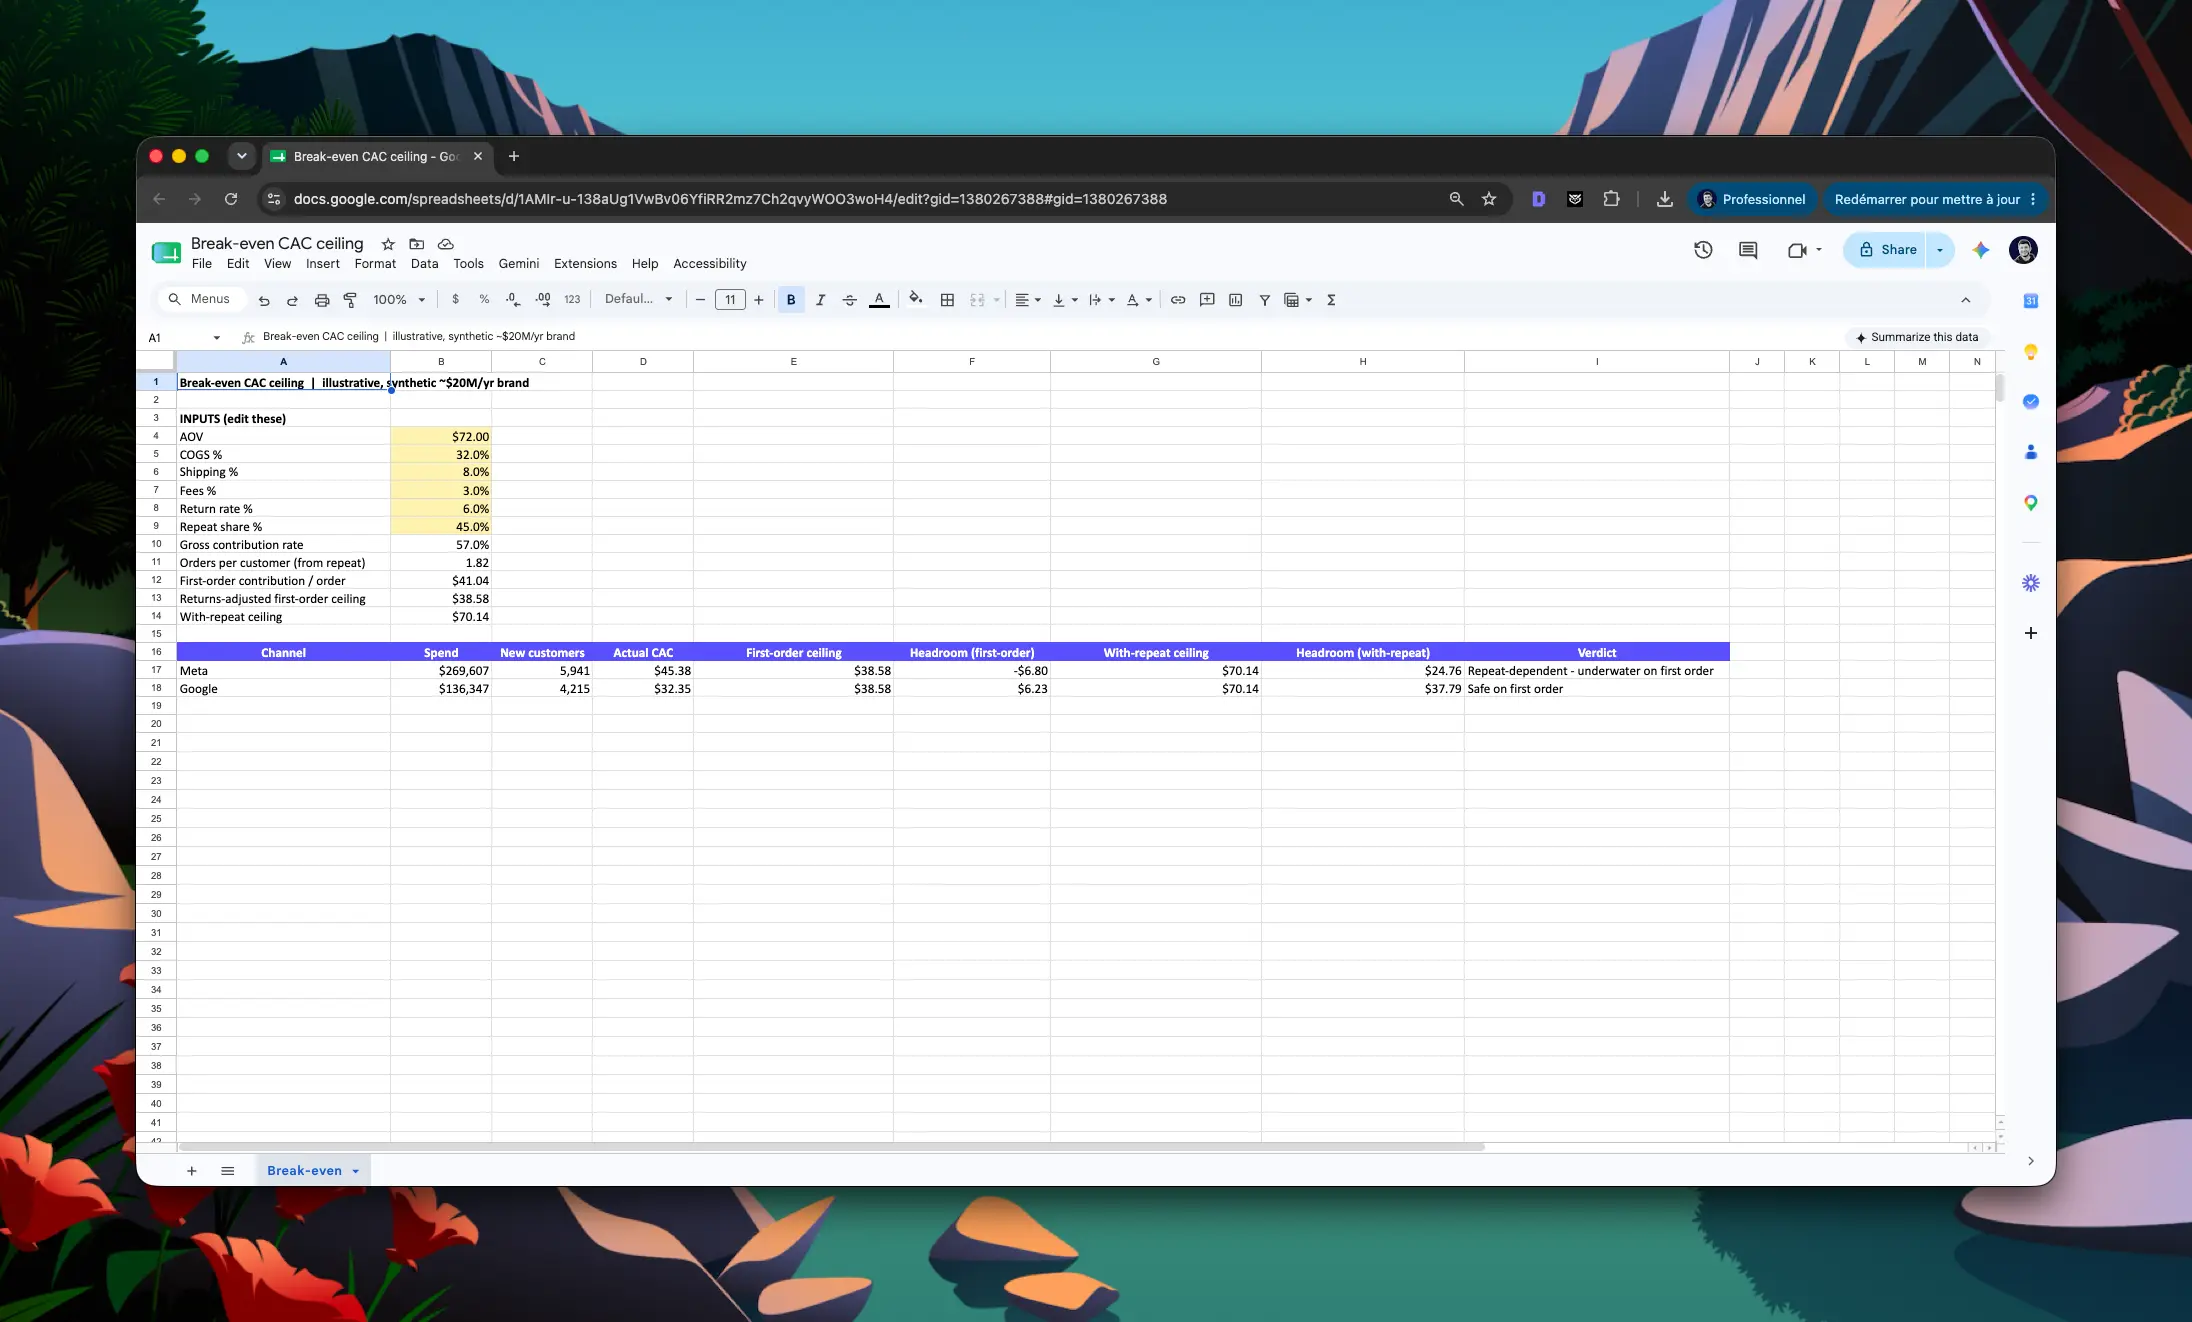
Give Claude this prompt:
Using the Baseline tab, build a Break-even tab with one row per channel.
For each channel compute two break-even CAC ceilings, both as live formulas off the labeled cost cells:
- First-order ceiling = AOV times (1 minus COGS percent minus shipping percent minus fee percent), adjusted for return rate. This is the contribution a single order throws off before acquisition cost, so it is the most a first order alone can pay to acquire a customer.
- With-repeat ceiling = the first-order contribution multiplied by expected orders per customer, derived from repeat share. This is the ceiling if you are willing to bank on repeat behavior.
Beside each channel put its actual current CAC from the Baseline, and compute the headroom: break-even CAC minus actual CAC, as a dollar figure and a percent. Flag any channel where actual CAC is above the first-order ceiling in red, and above the with-repeat ceiling in bold red.
Keep every assumption in its own labeled cell. When I change COGS, shipping, returns, fees, or repeat share, every channel's ceiling and headroom must move.
Now you have the number you have been managing without. Two honest reads sit side by side: the first-order ceiling is the safe line you make money under no matter what, and the with-repeat ceiling is the line you make money under if your repeat behavior holds.
Spot-check before you trust it. Confirm the ceiling reproduces reality: a channel running comfortably today should show positive headroom against the with-repeat ceiling. If a channel you know is profitable reads as a breach, a cost input is wrong, not the channel.
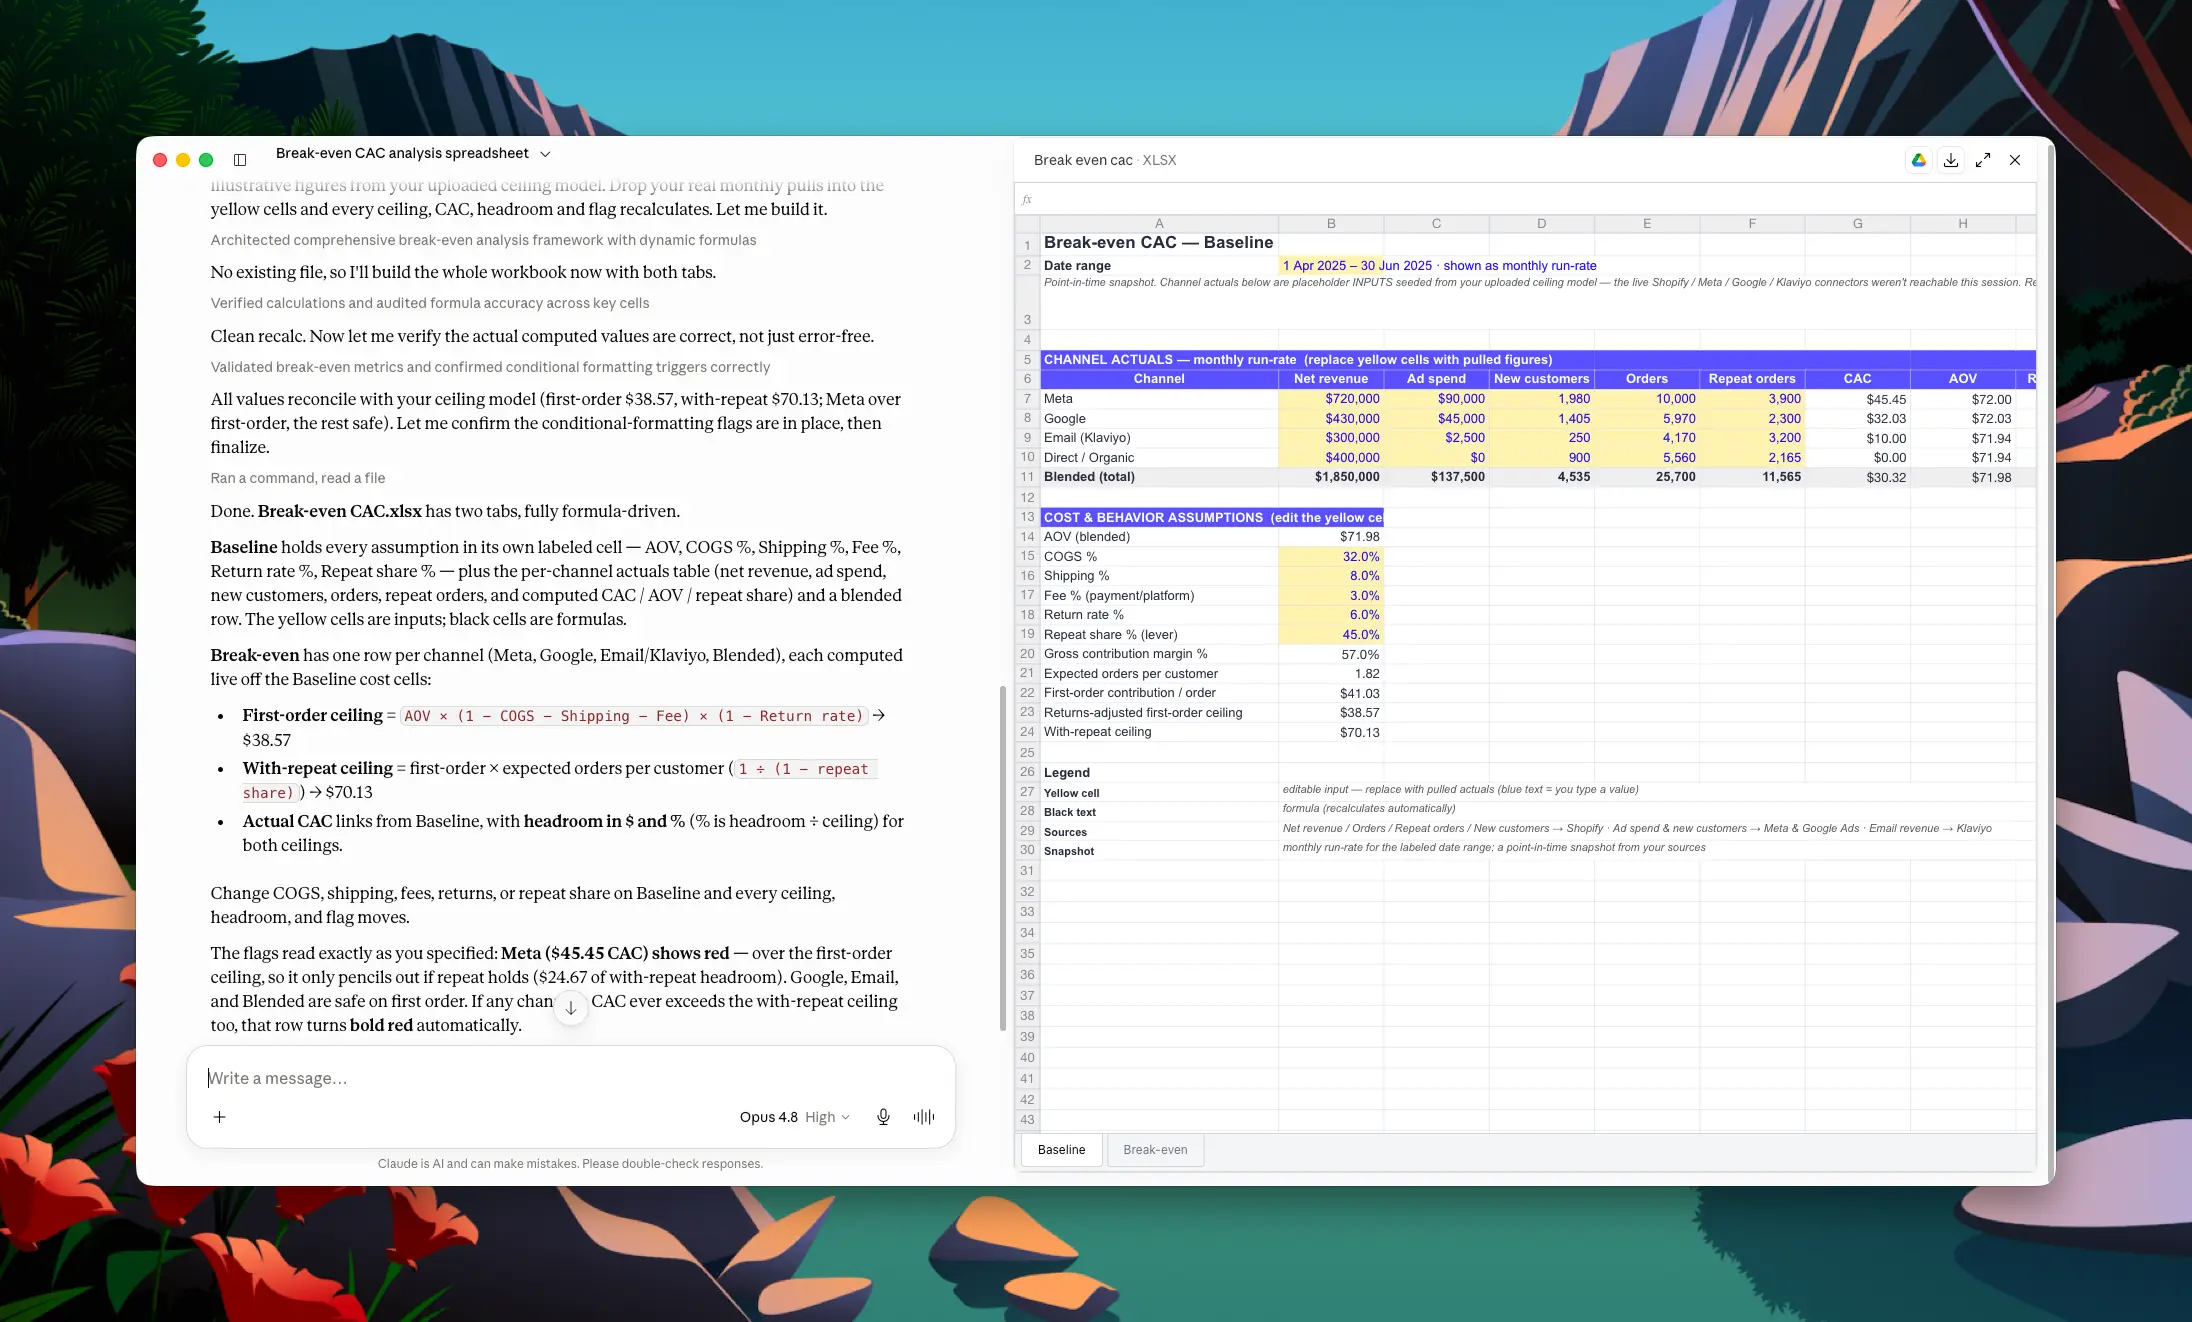
The headroom column is the answer. A channel with $12 of headroom can absorb rising CPMs before it stops paying; a channel already in breach is losing money on every new customer and volume was hiding it.
Change a cost input and watch it move. Push return rate up two points, add a shipping surcharge, model a COGS increase from a supplier. The moment a ceiling drops below your actual CAC, that channel just went contribution-negative on paper before it did on your P&L.
Because the baseline is a snapshot, you refresh it by re-running the prompt, not by scheduling a sync. Re-run it whenever your costs change or before you approve a CAC target. Save the prompt, the prompt is the asset.
Optional, but the ceiling is a margin calculation, so its soft spot is the margin.
Without a single source of truth, Claude reconstructs contribution margin from raw rows and your typed-in COGS, shipping, and fee assumptions, and it reconstructs per-channel CAC from platform-reported conversions, which each channel counts generously. A ceiling built on a reconstructed margin and an inflated CAC can read precise and still be wrong.
Polar removes both problems: its semantic layer defines true contribution margin once across the whole business, COGS per product, shipping, returns, payment fees, and attributes spend to give true per-channel and new-customer CAC. Then the ceiling and the headroom are numbers you would set a real CAC target against.
Enable the Polar MCP and swap Step 2 for:
You can also re-run the ceiling across Polar's 10 attribution models and watch which channels change from headroom to breach depending on how you count.
