

A pre-mortem that returns the volume lift a discount needs just to break even on margin, before you hit send, next to the lift you actually get.
You are about to run a discount, and the question that actually matters, does this make money or lose it, gets answered after the promo is over, from the P&L, when it is too late to change anything. This builds the answer before you hit send. Type the discount, your expected lift, and how much full-price demand it cannibalizes, and the sheet returns the volume lift you need just to break even on margin, next to the lift you have actually gotten historically.
Most promos are contribution-negative and the brand finds out afterward. A discount compresses the margin on every order, so you need meaningfully more orders just to stand still. Slide the discount from 10 percent to 30 percent and watch the break-even lift climb past anything you have ever actually hit. About 20 minutes to build once, then it is your go/no-go on every promo.
This exact model, simulated and verified end to end on a synthetic ~$20M/yr DTC brand. Here's the spreadsheet 👇
https://docs.google.com/spreadsheets/d/1fVkLizvB2DhzayXL7l8ILg22-W7pG_QAlphO_uH-zmM/edit?usp=sharing
A spreadsheet with two tabs:
Claude builds it as an Excel file, you open it in Google Drive, and it becomes a live Google Sheet. Change the discount and every output moves.
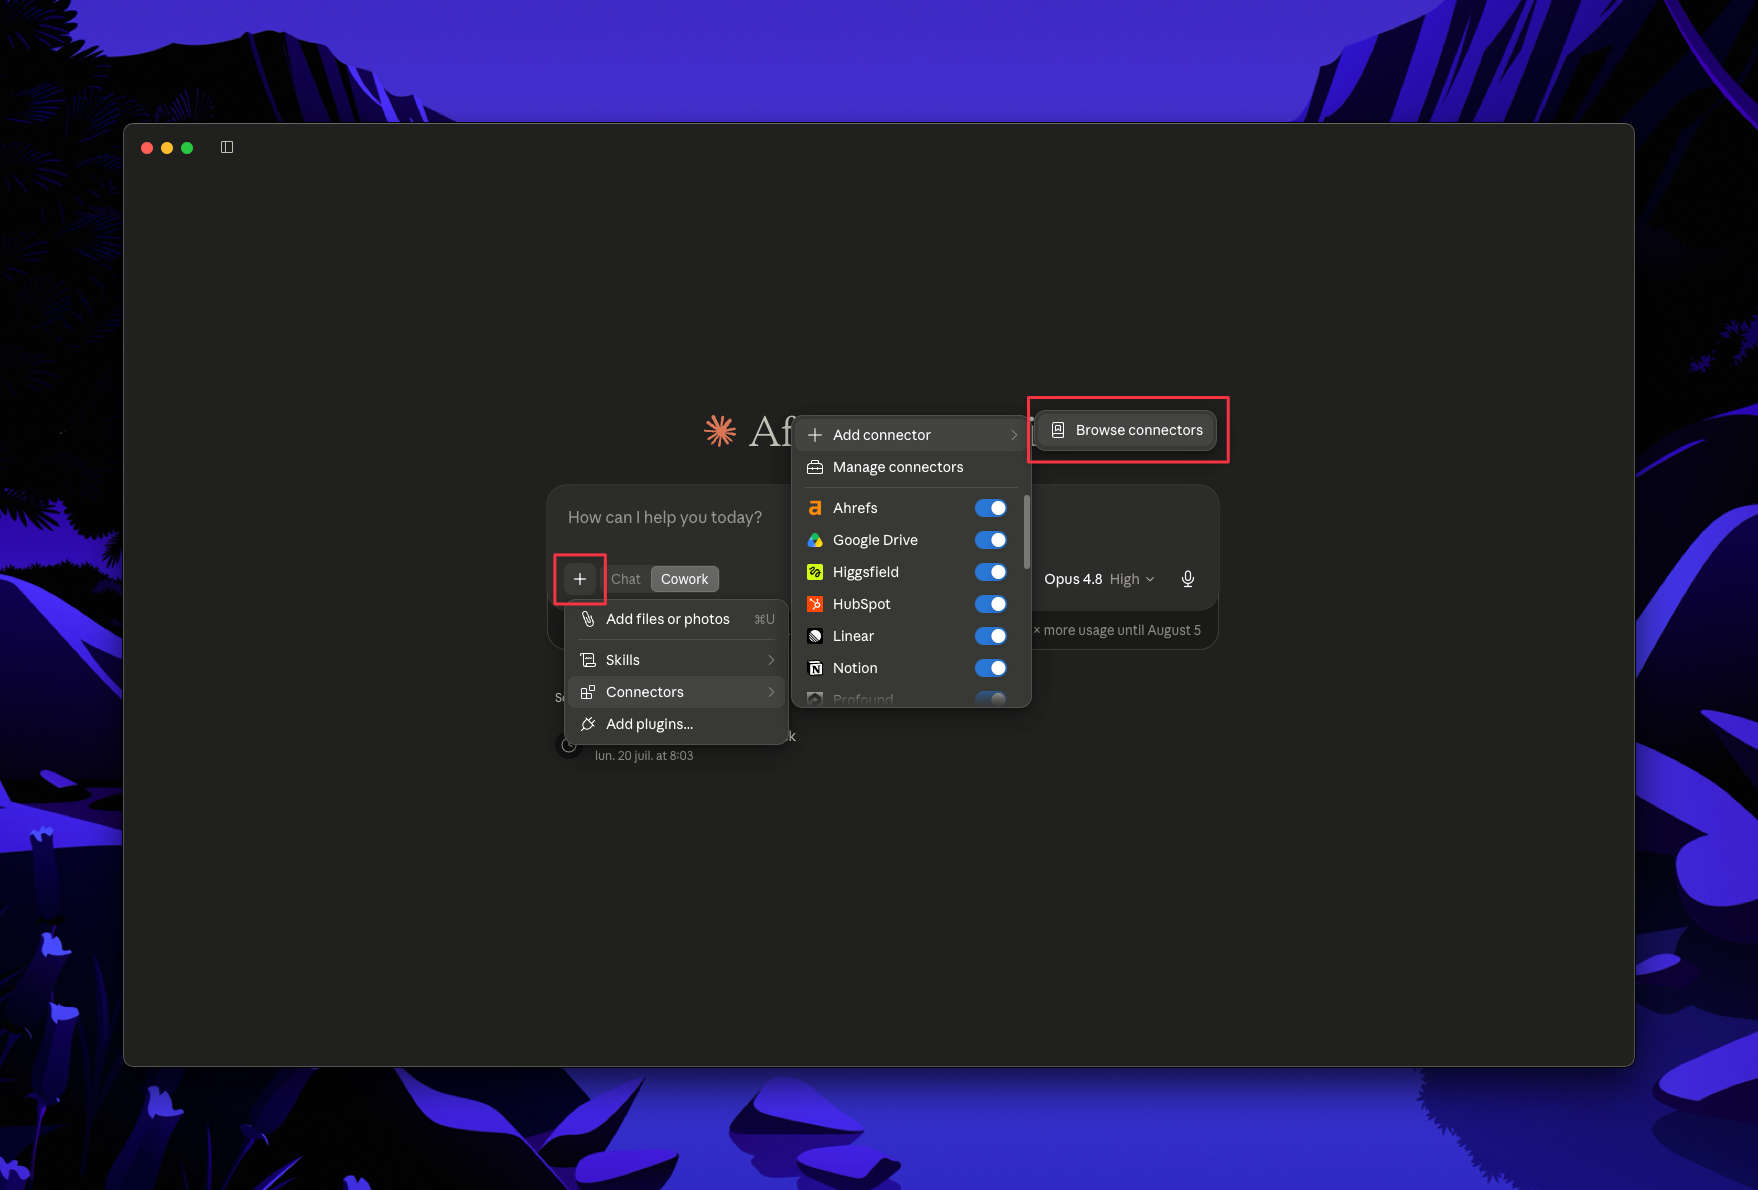
In Claude, open Connectors and connect Shopify (first-party, a couple of clicks). Shopify carries the order-level data the model needs: AOV, and the sales during your past discount windows that tell you what lift you actually get.
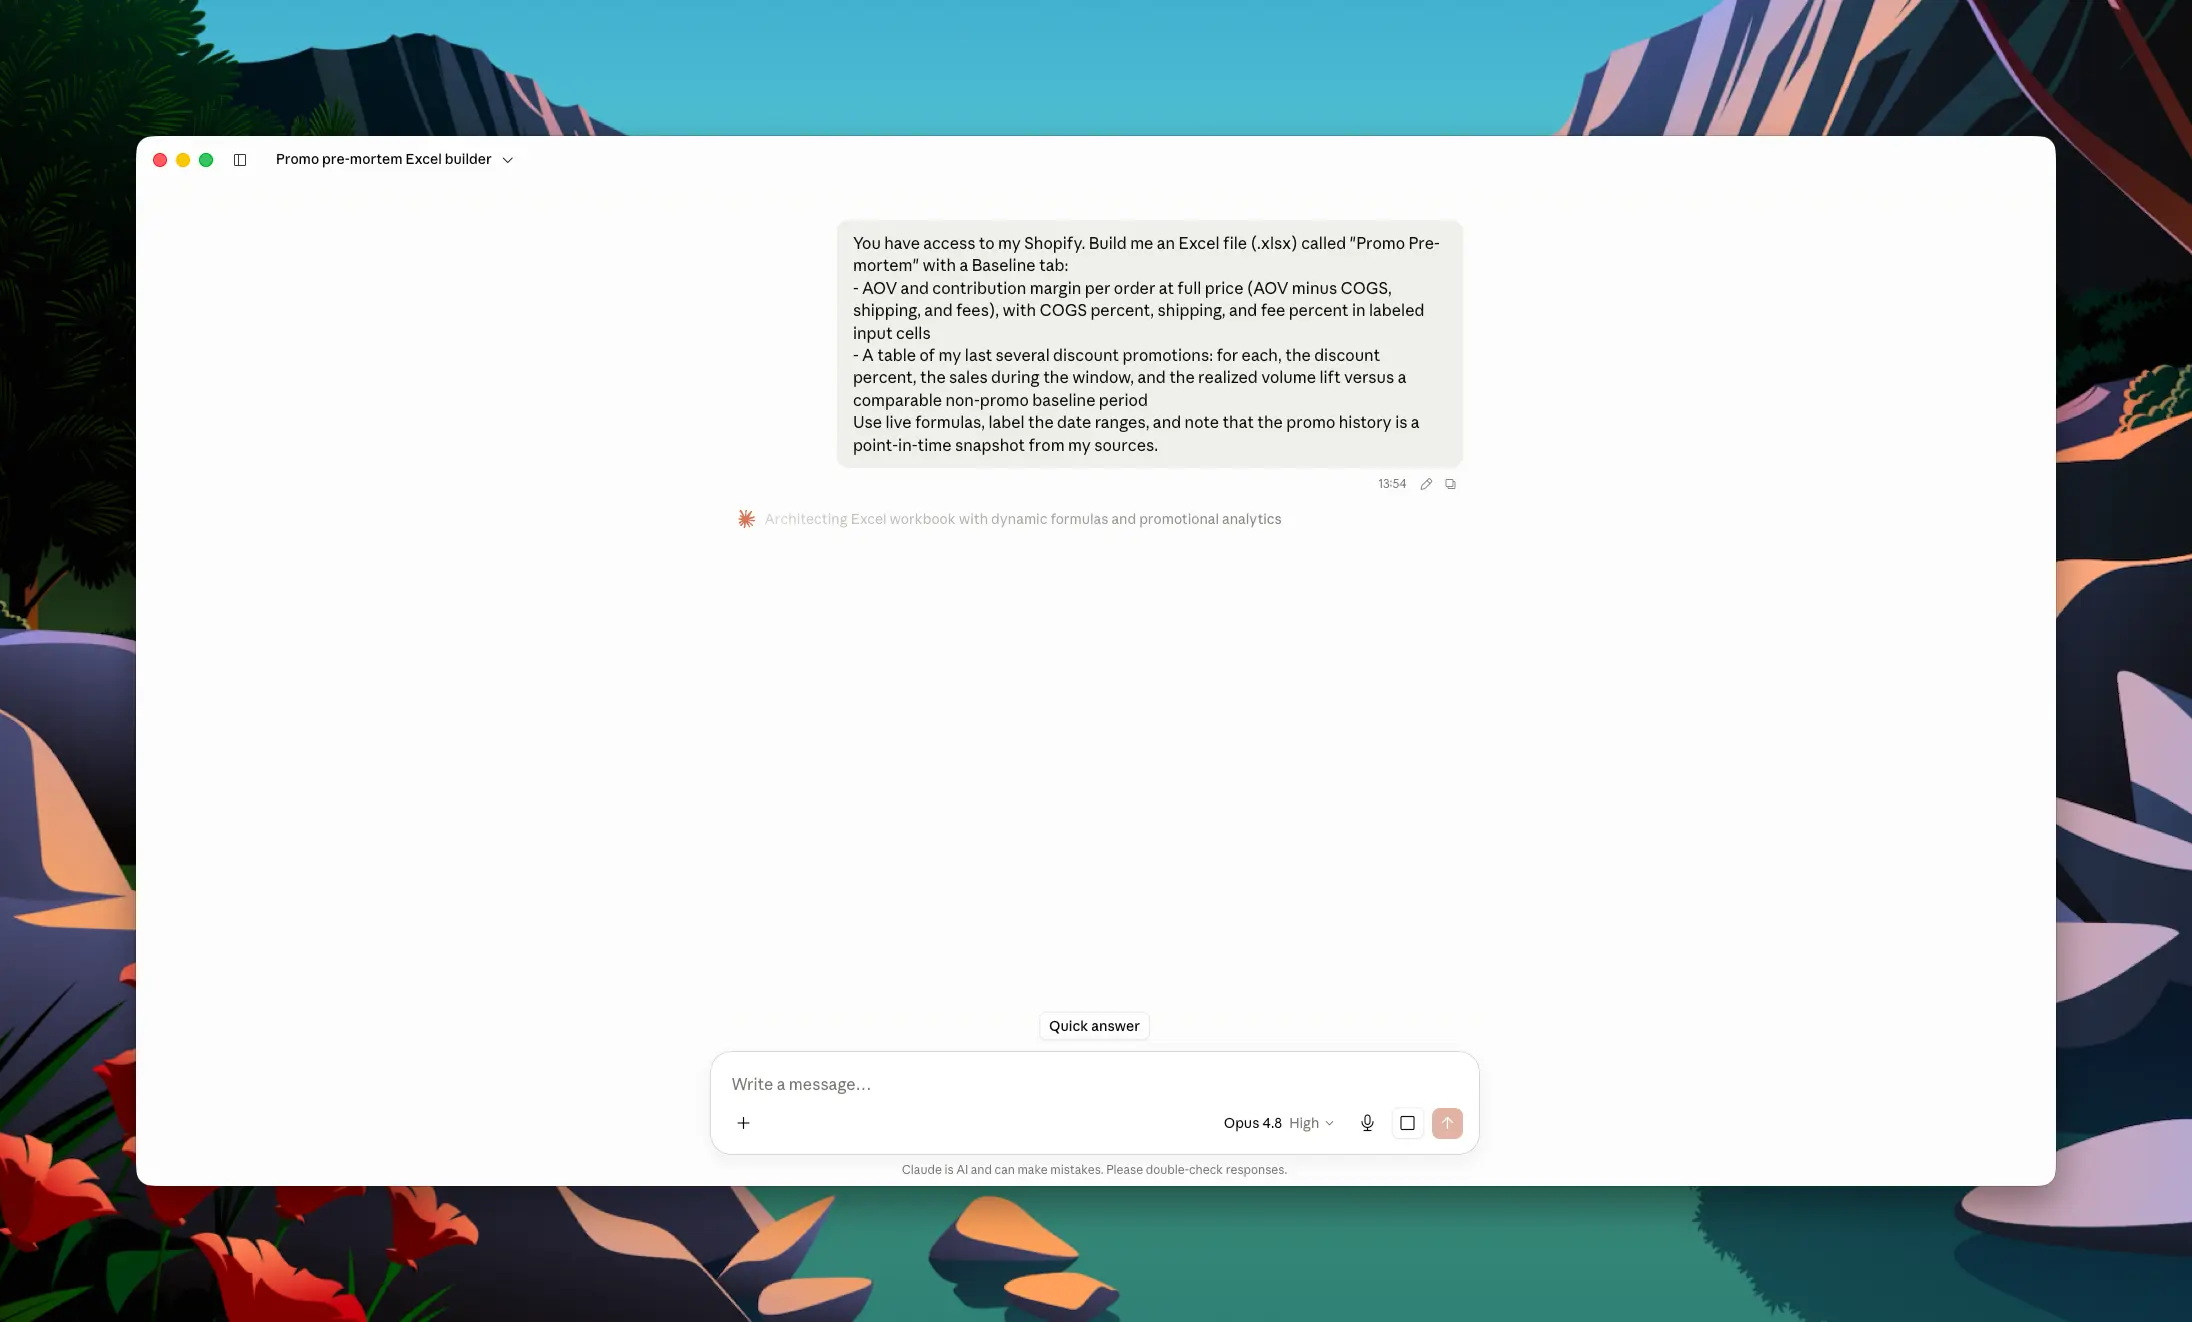
Give Claude this prompt:
You have access to my Shopify. Build me an Excel file (.xlsx) called "Promo Pre-mortem" with a Baseline tab:
- AOV and contribution margin per order at full price (AOV minus COGS, shipping, and fees), with COGS percent, shipping, and fee percent in labeled input cells
- A table of my last several discount promotions: for each, the discount percent, the sales during the window, and the realized volume lift versus a comparable non-promo baseline period
Use live formulas, label the date ranges, and note that the promo history is a point-in-time snapshot from my sources.
The promo history is what keeps this honest. Your "expected lift" in the next step should not be a hope; it should be anchored to the lift these same customers have actually given you before.
Give Claude this prompt:
Add a Promo tab that models a discount before I run it. Put these inputs in labeled cells: discount percent, expected volume lift, full-price cannibalization rate (the share of discounted orders that would have happened at full price anyway), and the promo window.
Compute, as live formulas:
- Contribution margin per order at the discount versus at full price
- Break-even lift: the volume lift needed for total contribution margin during the window to equal what I would have made with no promo, accounting for cannibalization. Discounting full-price buyers who would have bought anyway is pure margin lost, so fold that in.
- Projected margin impact: given my expected lift, the dollar contribution gained or lost versus running no promo
- A go/no-go read: green if expected lift comfortably clears break-even lift, red if it does not
Beside the break-even lift, show my historical average lift from the Baseline table so I can see the gap. When I change the discount, every output recomputes.
Now the sheet answers the real question. A 20 percent sitewide discount does not need 20 percent more orders to pay for itself; because it also compresses margin and cannibalizes full-price sales, it can need far more, and the model shows exactly how much.
Spot-check before you trust it. Set the discount to zero and confirm the break-even lift reads zero and the margin impact reads zero. If it does not, the cannibalization term is wired wrong.
Slide the discount and watch the break-even lift climb. Push it to 30 percent and it often asks for a lift you have never once achieved. That is the sheet saying no in the only language that matters.
Then stress the honest inputs. Raise the cannibalization rate and the promo gets worse, because you are paying to discount people who were going to buy anyway. Lower your expected lift toward your historical average and watch a green go turn red. The go/no-go is only as good as those two assumptions, which is exactly why they sit in labeled cells instead of hidden in a formula.
Optional, but two inputs decide the call and both are only as good as your definitions.
Two things in this model are only as good as your definitions. First, the contribution margin per order: without a single source of truth, Claude reconstructs it from typed-in COGS, shipping, and fee assumptions, and if that per-order margin is off, every break-even number inherits the error. Second, the promo history: measuring realized lift means comparing a promo window to a clean baseline, and that comparison is only trustworthy on consistently defined revenue and margin.
Polar removes both: its semantic layer defines true contribution margin once across the whole business, and it holds a consistent history you can measure lift against.
Enable the Polar MCP and swap Step 2 for:
With Polar you can also look past the window at whether promo-acquired customers actually repeat, which is the one argument that can justify a promo the single-window math says to skip.
