

A driver-based reorder model that flags which SKUs stock out before a reorder lands and which quietly trap cash at a margin too thin to justify.
You manage ad spend to the dollar and reorder inventory on gut. This builds the same driver-based rigor for the buy: a spreadsheet that tells you which SKUs stock out before a reorder can arrive, and which are quietly tying up cash at a margin too low to justify it. Velocity and per-SKU margin drive stockout dates and cash-tied-up, lead times sit in labeled cells, and the moment a supplier slips you change one number and watch the reorder dates move.
Two failure modes cost real money and both are invisible on a revenue report: the hero SKU that sells out mid-month because nobody watched the runway, and the slow SKU sitting on 140 days of stock at a thin margin, holding cash you could have spent acquiring customers. This model surfaces both. About 25 minutes to build once, then it is your standing weekly reorder read.
This exact model, simulated and verified end to end on a synthetic ~$20M/yr DTC brand. Here's the spreadsheet 👇
https://docs.google.com/spreadsheets/d/1-3rF5ndmjDynK7EX1hCUeqcBq_s0z2czrH4XYwIHbO0/edit?usp=sharing
A spreadsheet with two tabs:
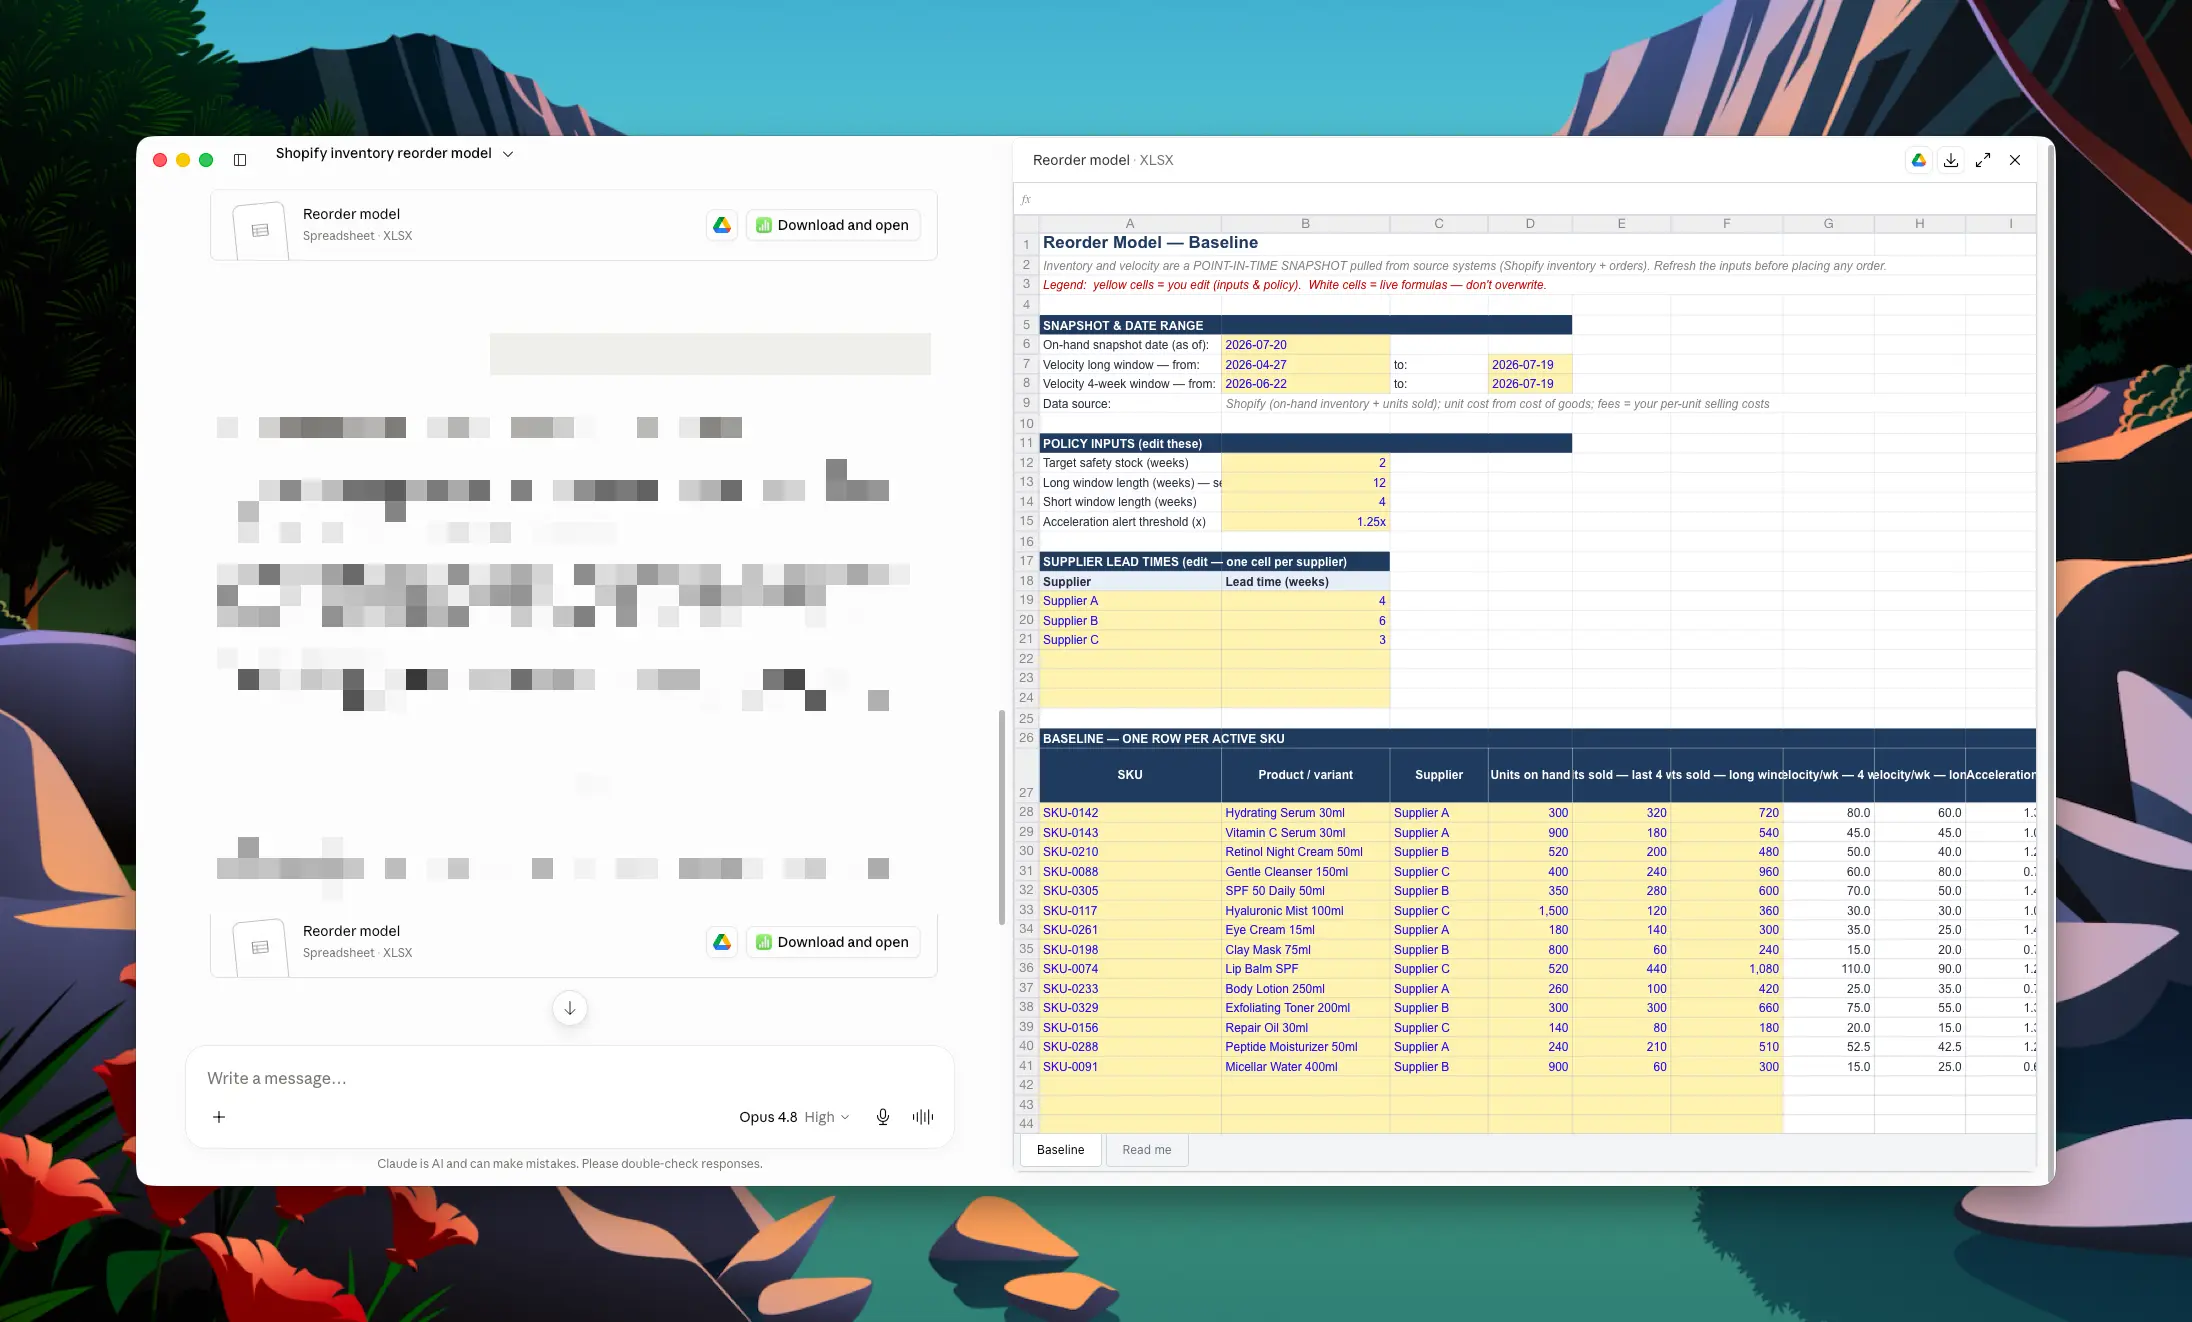
Claude builds it as an Excel file, you open it in Google Drive, and it becomes a live Google Sheet. Change a lead time or a velocity and the reorder dates and the cash numbers move.
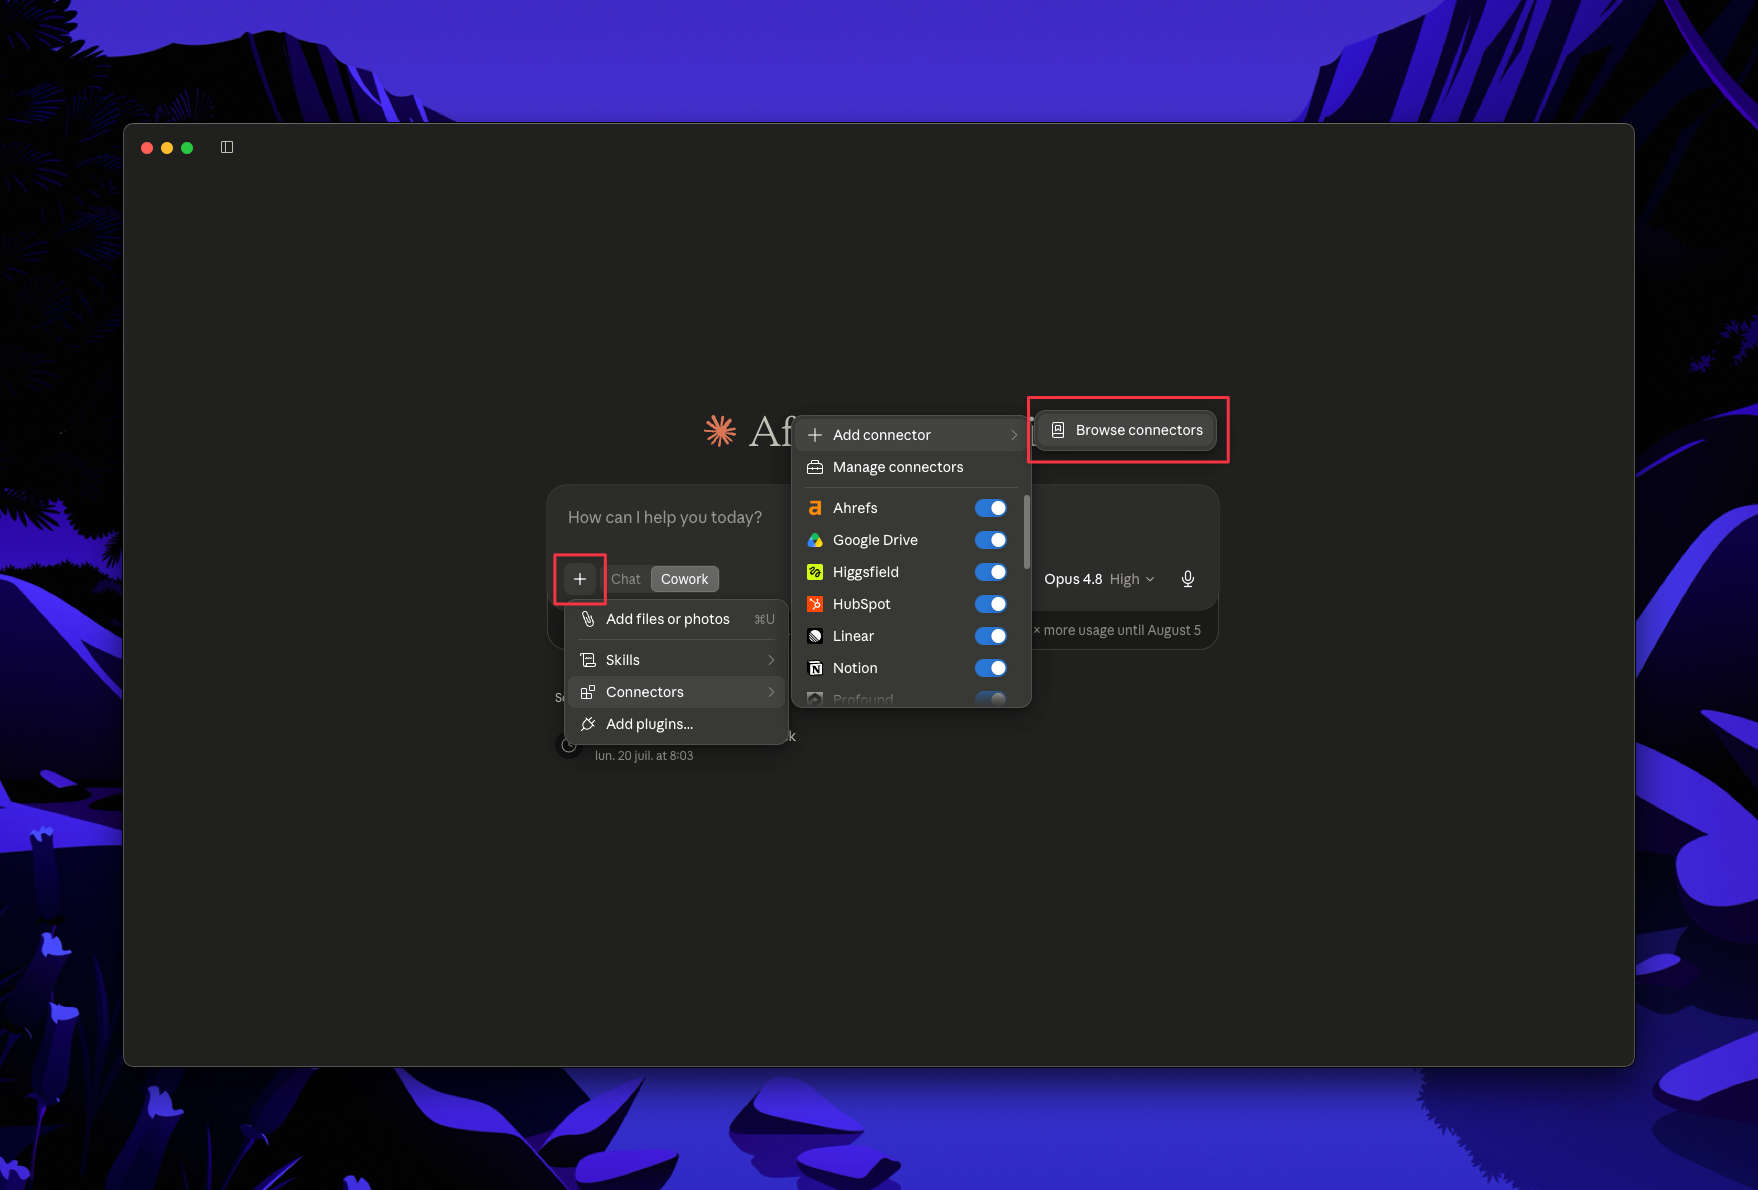
In Claude, open Connectors and connect Shopify (first-party, a couple of clicks). Shopify carries units sold over time, which is the velocity the model runs on, and current inventory levels. Lead times and safety-stock policy are yours to type in; the model keeps them in labeled cells so a supplier change is a one-number edit.

Give Claude this prompt:
You have access to my Shopify. Build me an Excel file (.xlsx) called "Reorder Model" with a Baseline tab, one row per active SKU:
- Units on hand right now
- Weekly sell-through velocity, as an average of the last 8 to 12 weeks, and also the last 4 weeks so I can see if it is accelerating
- Unit cost and contribution margin per unit (with COGS and any per-unit fees in labeled input cells)
Then add labeled policy cells I can edit: target safety-stock in weeks, and a lead-time cell per supplier.
Use live formulas, label the date range, and note that inventory and velocity are a point-in-time snapshot from my sources.
Download it, open it in Google Drive, and check the velocity for two SKUs you know well before building on it.
Give Claude this prompt:
Add a Reorder tab that reads the Baseline. Per SKU, compute as live formulas:
- Days of cover = units on hand divided by daily velocity
- Reorder point = (daily velocity times lead time) plus safety stock
- Projected stockout date and recommended reorder date (the stockout date minus the lead time)
- Cash tied up = units on hand times unit cost
Then two flag columns:
- Stockout risk: flag when days of cover is less than the lead time, so the SKU will run out before a reorder placed today could arrive. Sort these to the top.
- Cash trap: flag when days of cover is far above target AND contribution margin per unit is below the catalog average, so the SKU is holding cash at a return that does not justify it. Show the dollars tied up beside the flag.
Keep lead time, safety stock, and the cash-trap thresholds in labeled cells. When I change a lead time or a velocity, the reorder dates and cash figures must move.
Now the buy is a decision with numbers under it. The stockout-risk flags are what to reorder now; the cash-trap flags are where your working capital is stuck earning a poor margin.
Spot-check before you trust it. Confirm the reorder dates are ordered sensibly, a fast SKU with little cover should show an earlier reorder date than a slow one with months of stock. If they are not ordered, the velocity or the lead-time reference is wired wrong on some rows.
Read the stockout-risk flags first: those are the reorders that cannot wait. Then read the cash traps: those are the conversations about markdowns, bundles, or simply not reordering.
Change a lead time and watch the recommended reorder dates jump earlier, that is what a supplier saying "we slipped two weeks" actually costs you in runway. Change a velocity assumption to model a promo or a seasonal lift and see which SKUs move into stockout risk. Because velocity is historical, re-run the model weekly so it tracks reality rather than last month's demand.
Optional, but the prioritization is only as honest as your per-SKU margin.
The reorder logic is sound on Shopify alone, but the prioritization has a soft spot. Deciding which SKUs deserve your cash means ranking them by margin, and margin is exactly the number defined inconsistently across tools. Reorder on revenue velocity alone and you will faithfully restock your best-selling, worst-margin SKU while starving the quiet product that actually carries the P&L.
Polar fixes the prioritization: it defines true contribution margin per SKU once, COGS, shipping, returns, fees, on the same governed dataset as your sell-through, so the reorder model can weigh a SKU by what it actually contributes, not just what it sells.
Enable the Polar MCP and swap Step 2 for:
With Polar the margin behind every reorder call is a governed number, so you can rank the buy by the contribution actually at risk and stop restocking your worst-margin bestseller.
