

A diagnosis artifact in Claude: enter a date and the revenue you expected, hit Run, and get the causes ranked by contribution, each with a confidence level, in about a minute.
Revenue drops, or spikes, and the whole team spends the afternoon guessing. Was it spend, a channel pulling back, a hero SKU going out of stock, a discount that cannibalized full-price demand, a wave of returns landing at once?
Shopify tells you the number moved. It does not tell you why, because the why is spread across spend, attribution, product mix, margin, and returns, and no single Shopify report holds all of them. This use case turns the question into a Claude artifact: enter a date and the revenue you expected, click Run, and get the causes ranked by contribution, with a confidence level, instead of a hunch.
Below is a full worked example: the exact diagnosis, run end to end on a ~$31M/yr DTC brand. Then two ways to build your own, with Polar and without.
The setup: a ~$31M/yr DTC brand, Shopify reconciled to gross in Polar, ad platforms and Klaviyo connected. Over the last four weeks, net revenue came in at $2.11M against an expected $2.39M, down 11.5 percent. Nobody on the team knew why. The window and the expected number went into the artifact, then Run:
The read: this was not a demand problem or a product problem. Someone cut Meta prospecting by a third, which alone explains about 70 percent of the gap, and a replenishment cohort in one collection lapsed at the same time, which explains most of the rest. Everything else was ordinary movement. That is a budget conversation and a lifecycle conversation, not a panic.
One honest note on this example: the brand is a model built on illustrative synthetic data, because we do not publish client numbers. The diagnosis itself was validated the way you would validate it in production: we engineered the swing by injecting two known causes into the brand's data, then checked that the investigation recovered both and ranked them correctly before publishing. It did, and it flagged nothing else.
A diagnosis artifact that lives in Claude: two inputs, a date window and the net revenue you expected, and a Run button. On Run, it reads across spend, channel mix, new vs returning, product mix, discount depth, and returns, then writes the causal chain ranked by how much each factor contributed, with a confidence level and an honest note on what it cannot see. Build it once, run it every time a number moves. A senior analyst's afternoon, in about a minute.
You can run a version of this with nothing but Claude and your Shopify store. It is worth doing, both because it costs nothing and because it shows you exactly where the ceiling is.

Get the Claude desktop app, or use Claude in the browser. Either works; the artifact you build at the end lives in your account, not on your machine.
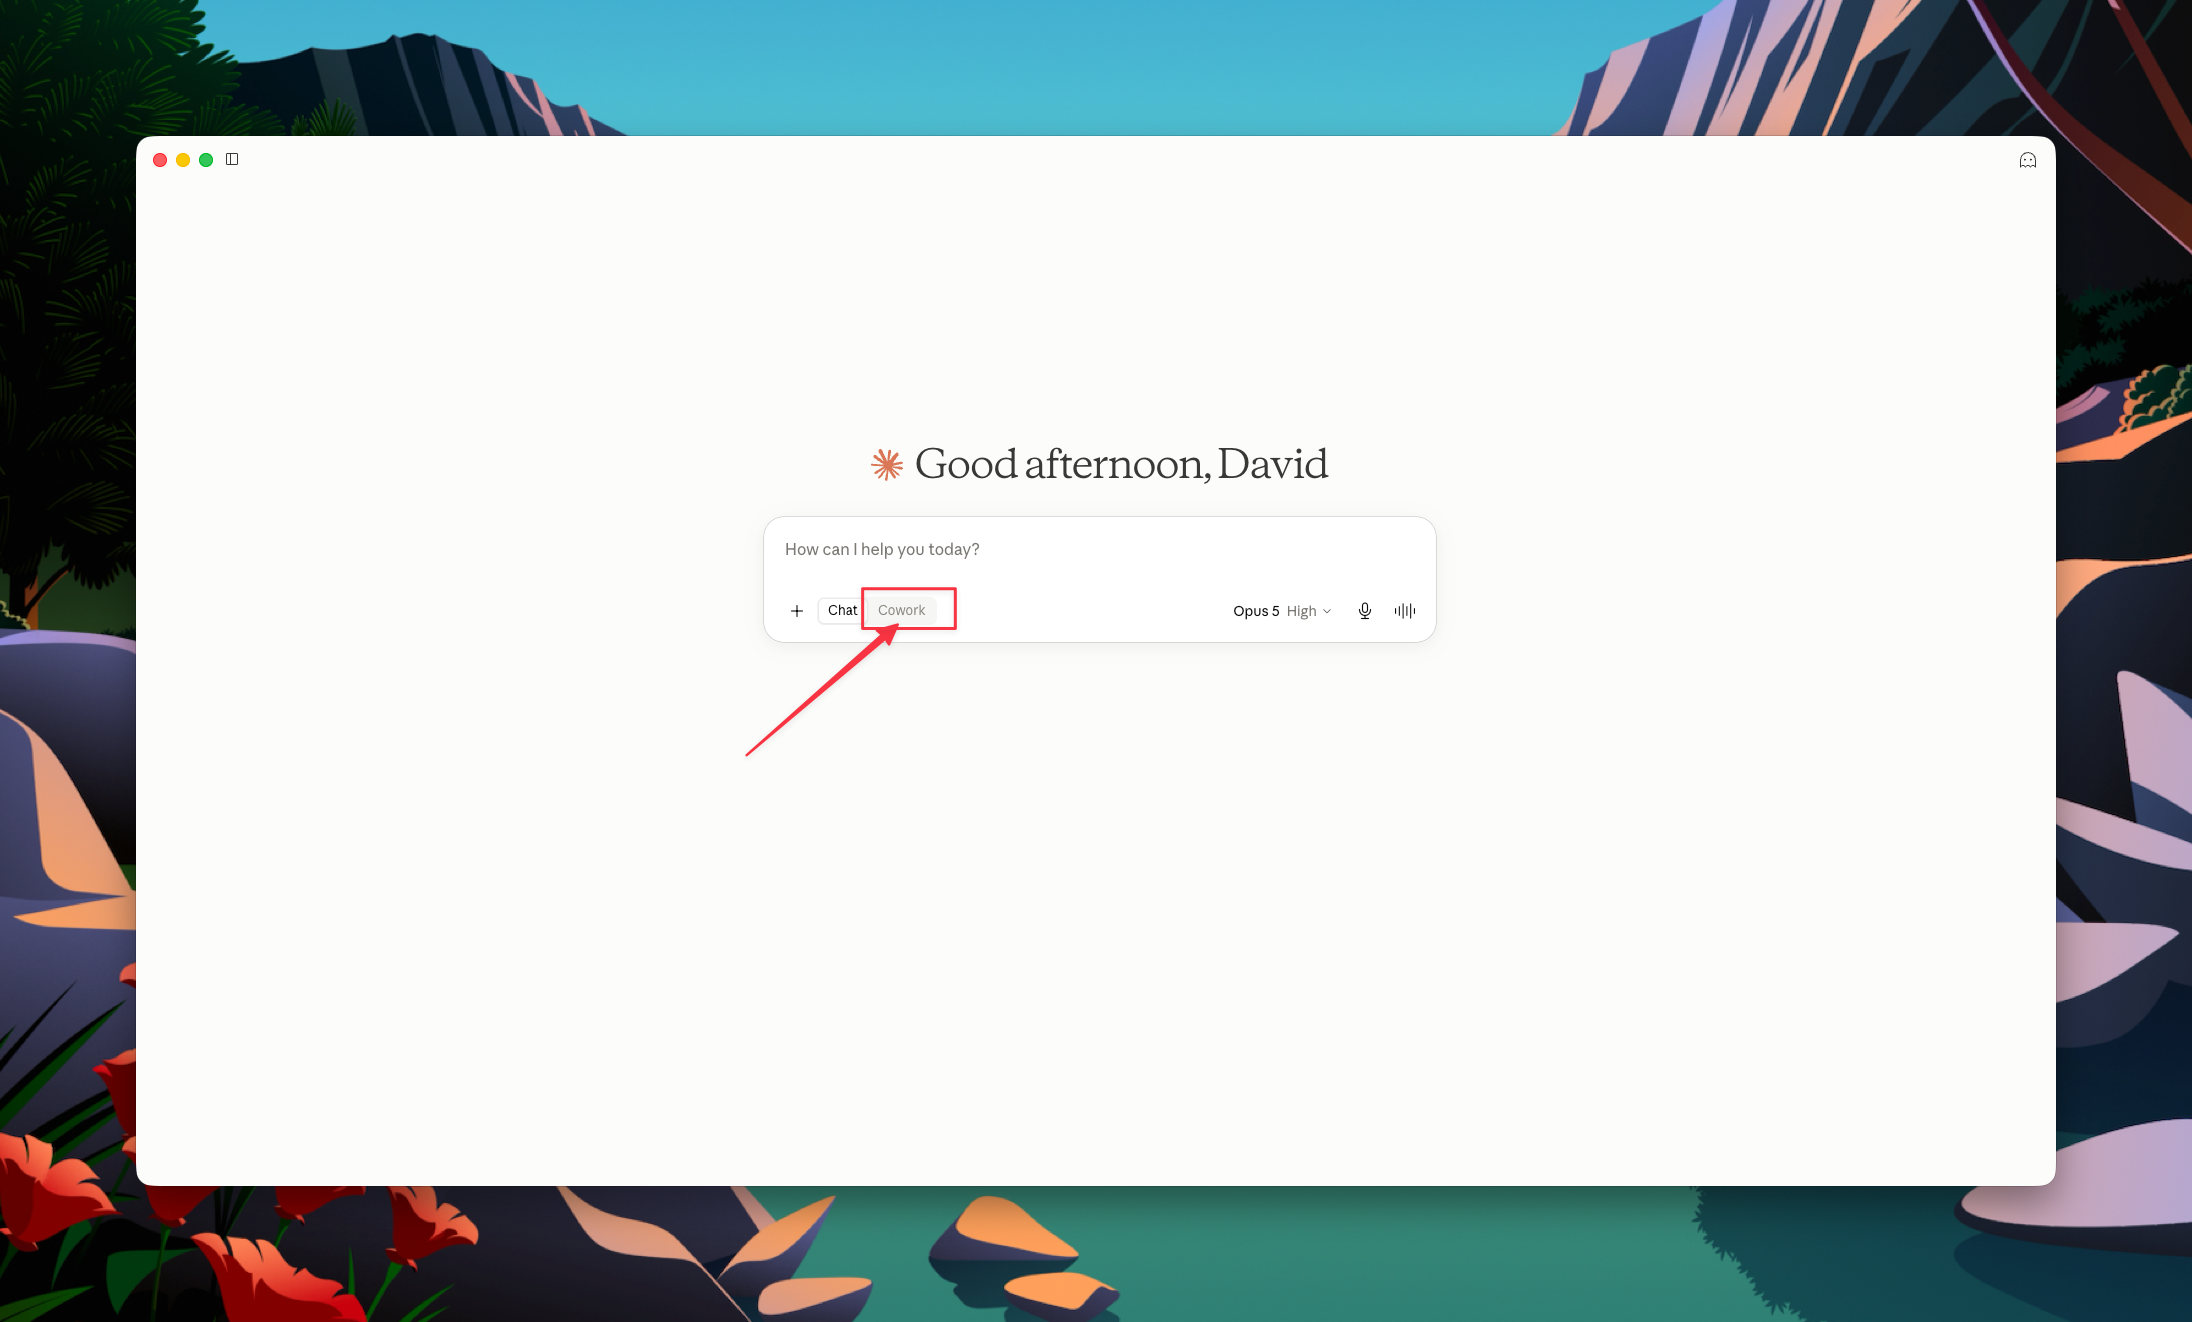
Open Cowork, Claude's workspace for longer-running work. A diagnosis is a multi-step investigation, not a one-line chat, and this is where it runs comfortably.
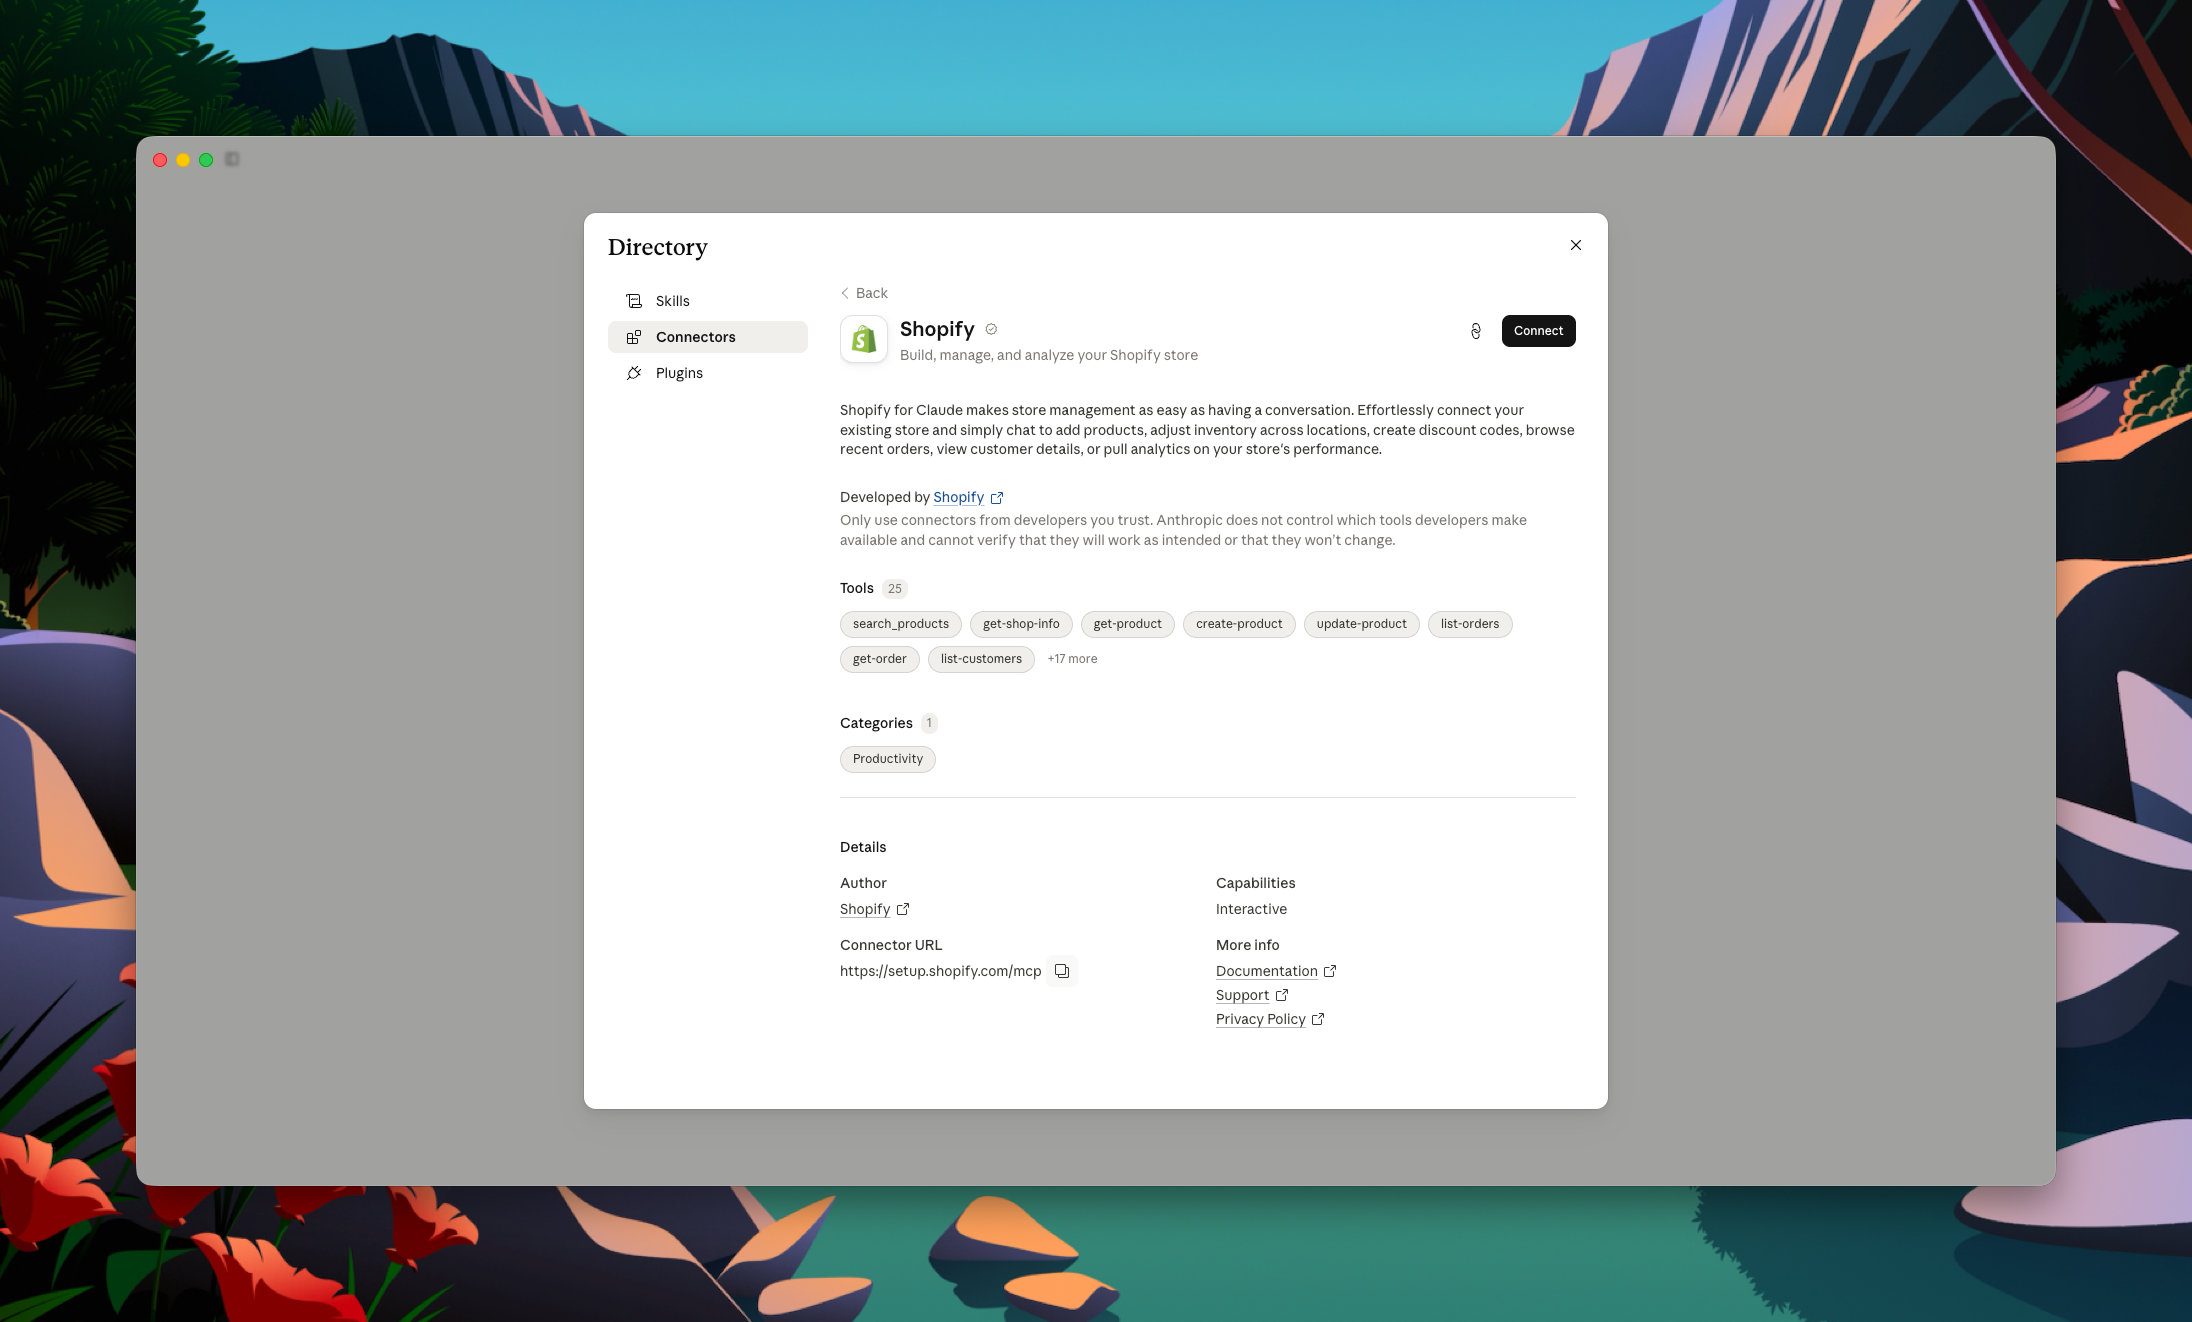
In Settings, open Connectors and connect your Shopify store. Read access is all a diagnosis needs; nothing here writes back to your store.

Be upfront about the ceiling before you run it: Shopify holds orders, sessions, discounts, refunds, and products. It does not hold ad spend, it does not hold real channel attribution (that is what the Polar Pixel exists for), and it does not hold margin. The prompt tells Claude to say so instead of guessing:
Using my Shopify MCP: net revenue for the last 4 weeks came in at [actual] against an expected [target]. Investigate why. Rank the causes by how much each contributed and give each a confidence level. You only have Shopify data, orders, sessions, discounts, refunds, products. Name every factor you cannot see from here, ad spend, marketing channels, attribution, margin, instead of forcing a cause.

On the worked-example brand, the Shopify-only version gets half the story right: it catches the returning-customer drop in the Supplements collection, and it sees that new-customer revenue fell. What it cannot tell you is why new customers fell, because the actual number one cause, Meta spend cut 36 percent, lives outside Shopify entirely. An honest run says "new-customer revenue fell $199K, cause not visible from Shopify data." A dishonest one blames whatever it can see. That is the ceiling.
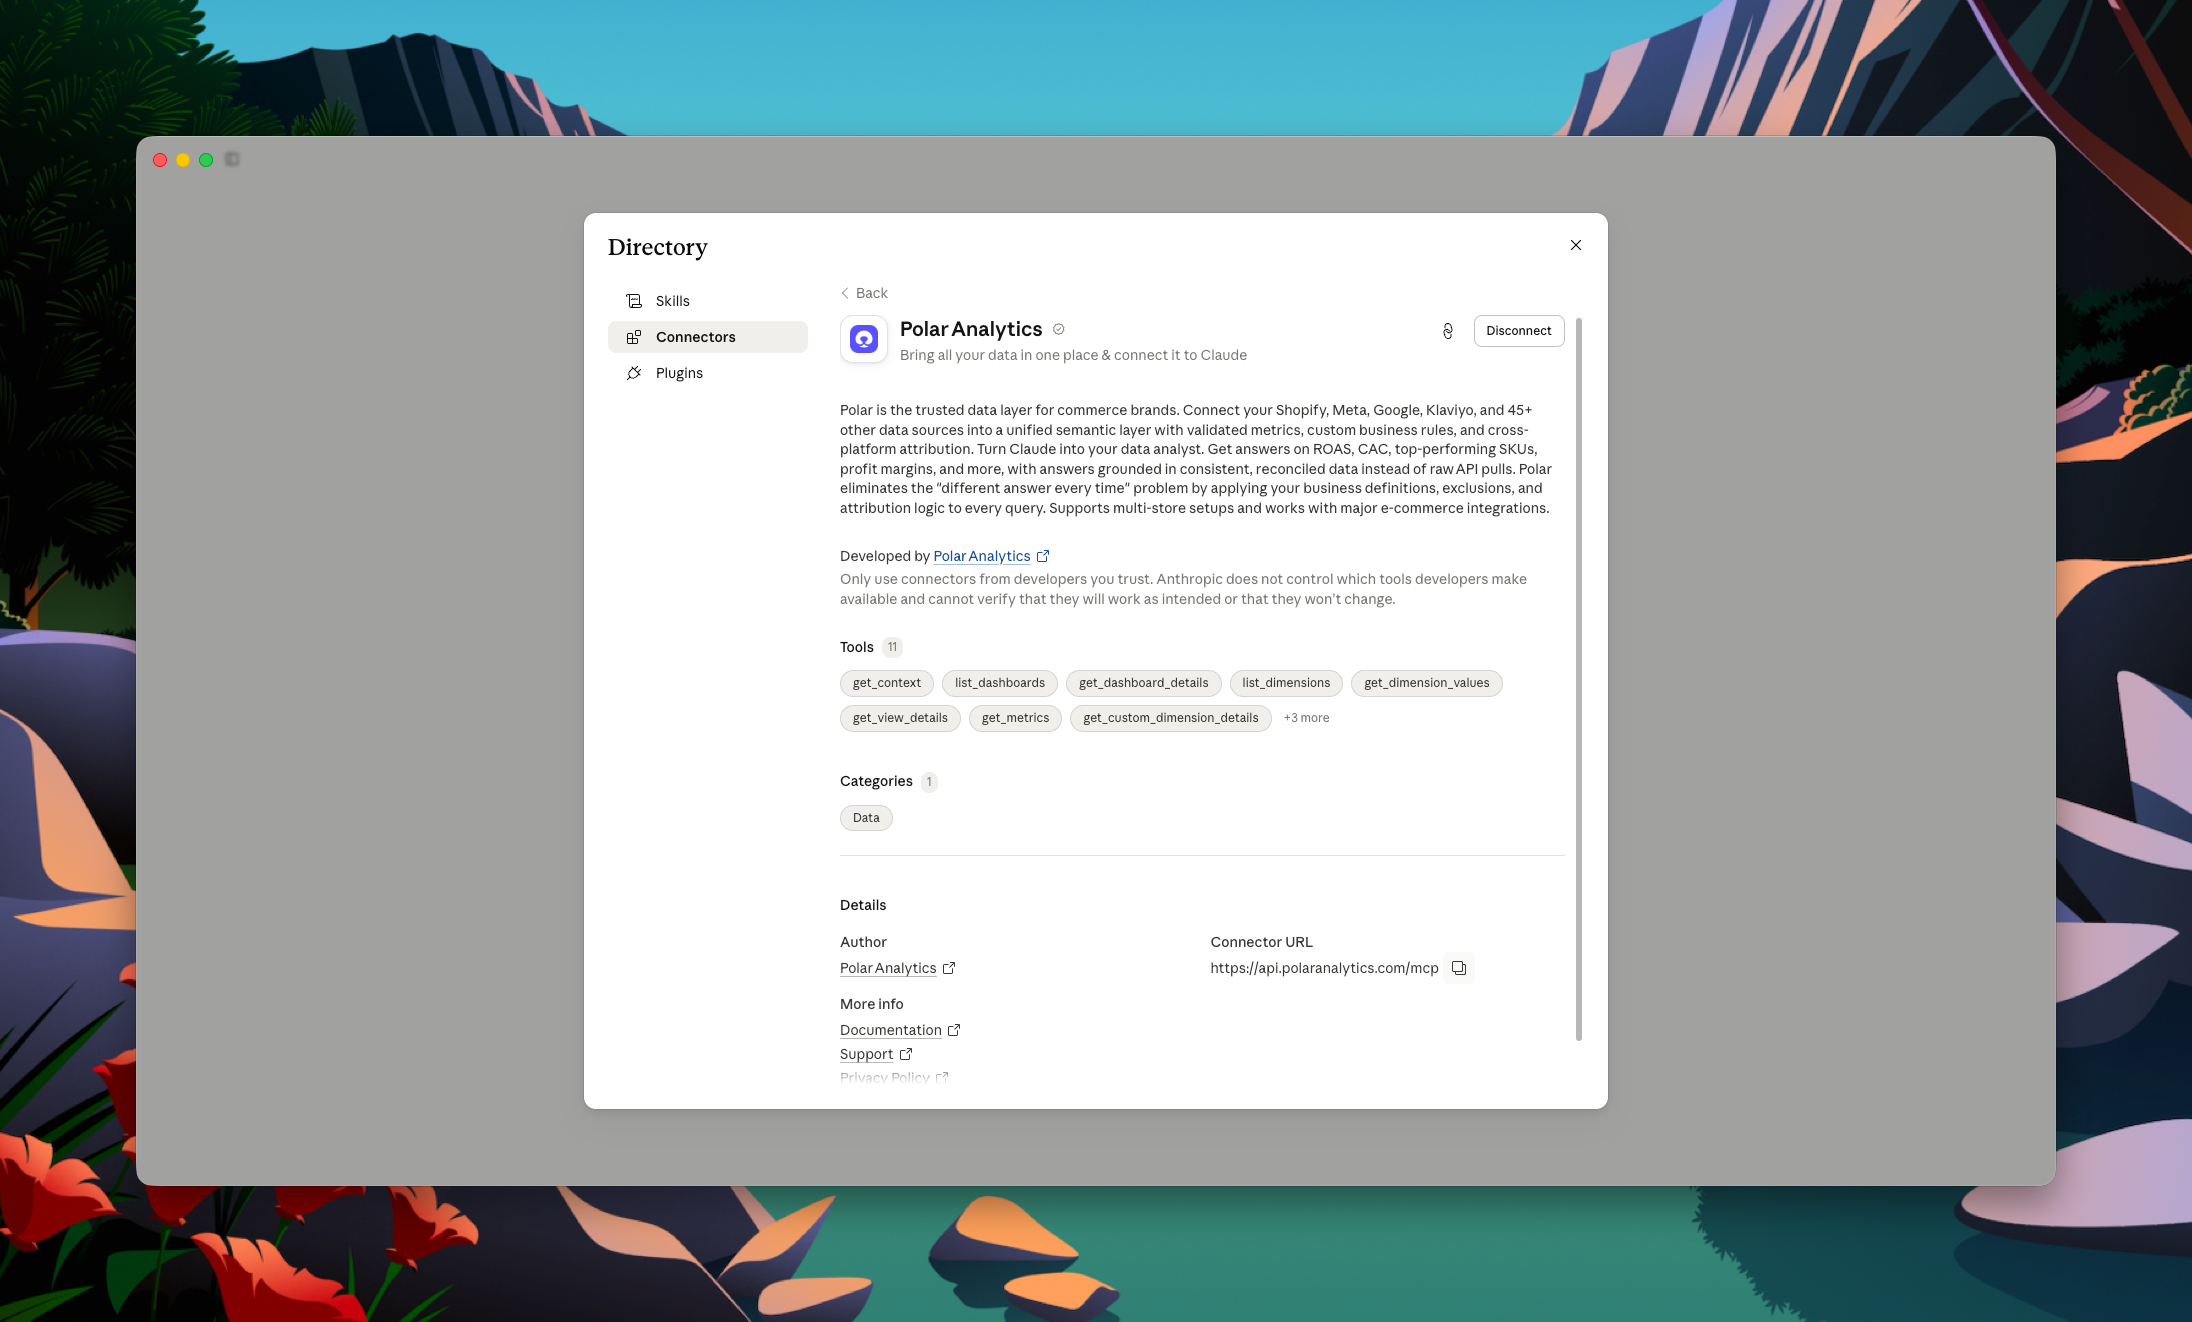

Connect the Polar MCP and run the exact same ask. Now the investigation reaches spend by channel, attributed revenue from the Polar Pixel, margin, and returns, all on governed definitions. The hole in Step 5 becomes the top-ranked cause: Meta pullback, $199K, high confidence, corroborated by the spend data itself. Same question, same brand, whole answer.
One more prompt, and the investigation becomes a tool you keep:
Build an artifact: a revenue diagnosis app. Two inputs, a date window and the net revenue I expected, and a Run button. On Run, investigate the gap using the Polar MCP across spend by channel, attributed revenue, new vs returning, product and collection mix, discount depth, and returns. Return the causes ranked by contribution, each with a rough magnitude and a confidence level, and end with what you cannot see. Make it clean enough to screenshot for my team.
That artifact is the asset. The next time a number moves, you enter the date and the target, hit Run, and read the diagnosis.
Not optional here. A ranked answer needs spend, attribution, margin, and returns reconciled in one place.
The exact thing Polar fixes: a real investigation has to cross spend, attribution, margin, and returns on consistent definitions in one place. Polar unifies those sources on a governed model, so the AI reasons over one reconciled picture instead of stitching exports together and hoping they agree.
The honest limitation without Polar: point an AI at Shopify alone and it can only investigate what Shopify holds, orders and sessions, so it will confidently attribute a swing to the wrong thing because the real cause (a channel, a margin shift) is invisible to it. Point it at a pile of exports and it investigates numbers that do not reconcile, which is worse than not asking.
Connect the Polar MCP and the whole investigation is one Run:
With Polar the causes rank on governed definitions of spend, attribution, margin, and returns, so the honesty line stays short: the AI names the few things it truly cannot see instead of guessing across everything it cannot reconcile.

A diagnosis that stays in a chat tab changes nothing. Ask Claude to add a share step to the artifact, a Send to Slack button, a Draft email button, and after each run it pre-drafts the message for your team: what moved, the ranked causes with their magnitude and confidence, and the honesty line. You review, you hit send, and the answer lands where the decision happens.
Add a share step to the artifact: after each run, draft a short Slack message and an email with the swing, the ranked causes with confidence levels, and what the diagnosis could not see, ready for me to review and send.