How Konges Sløjd Used Incrementality Testing to Benchmark Meta Performance and Challenge Attribution Bias

How Konges Sløjd Used Incrementality Testing to Benchmark Meta Performance and Challenge Attribution Bias

How Konges Sløjd Used Incrementality Testing to Benchmark Meta Performance and Challenge Attribution Bias
Plan
Shopify Plus
Data sources
connected
Polar users
Queries run
per month

About Konges Sløjd

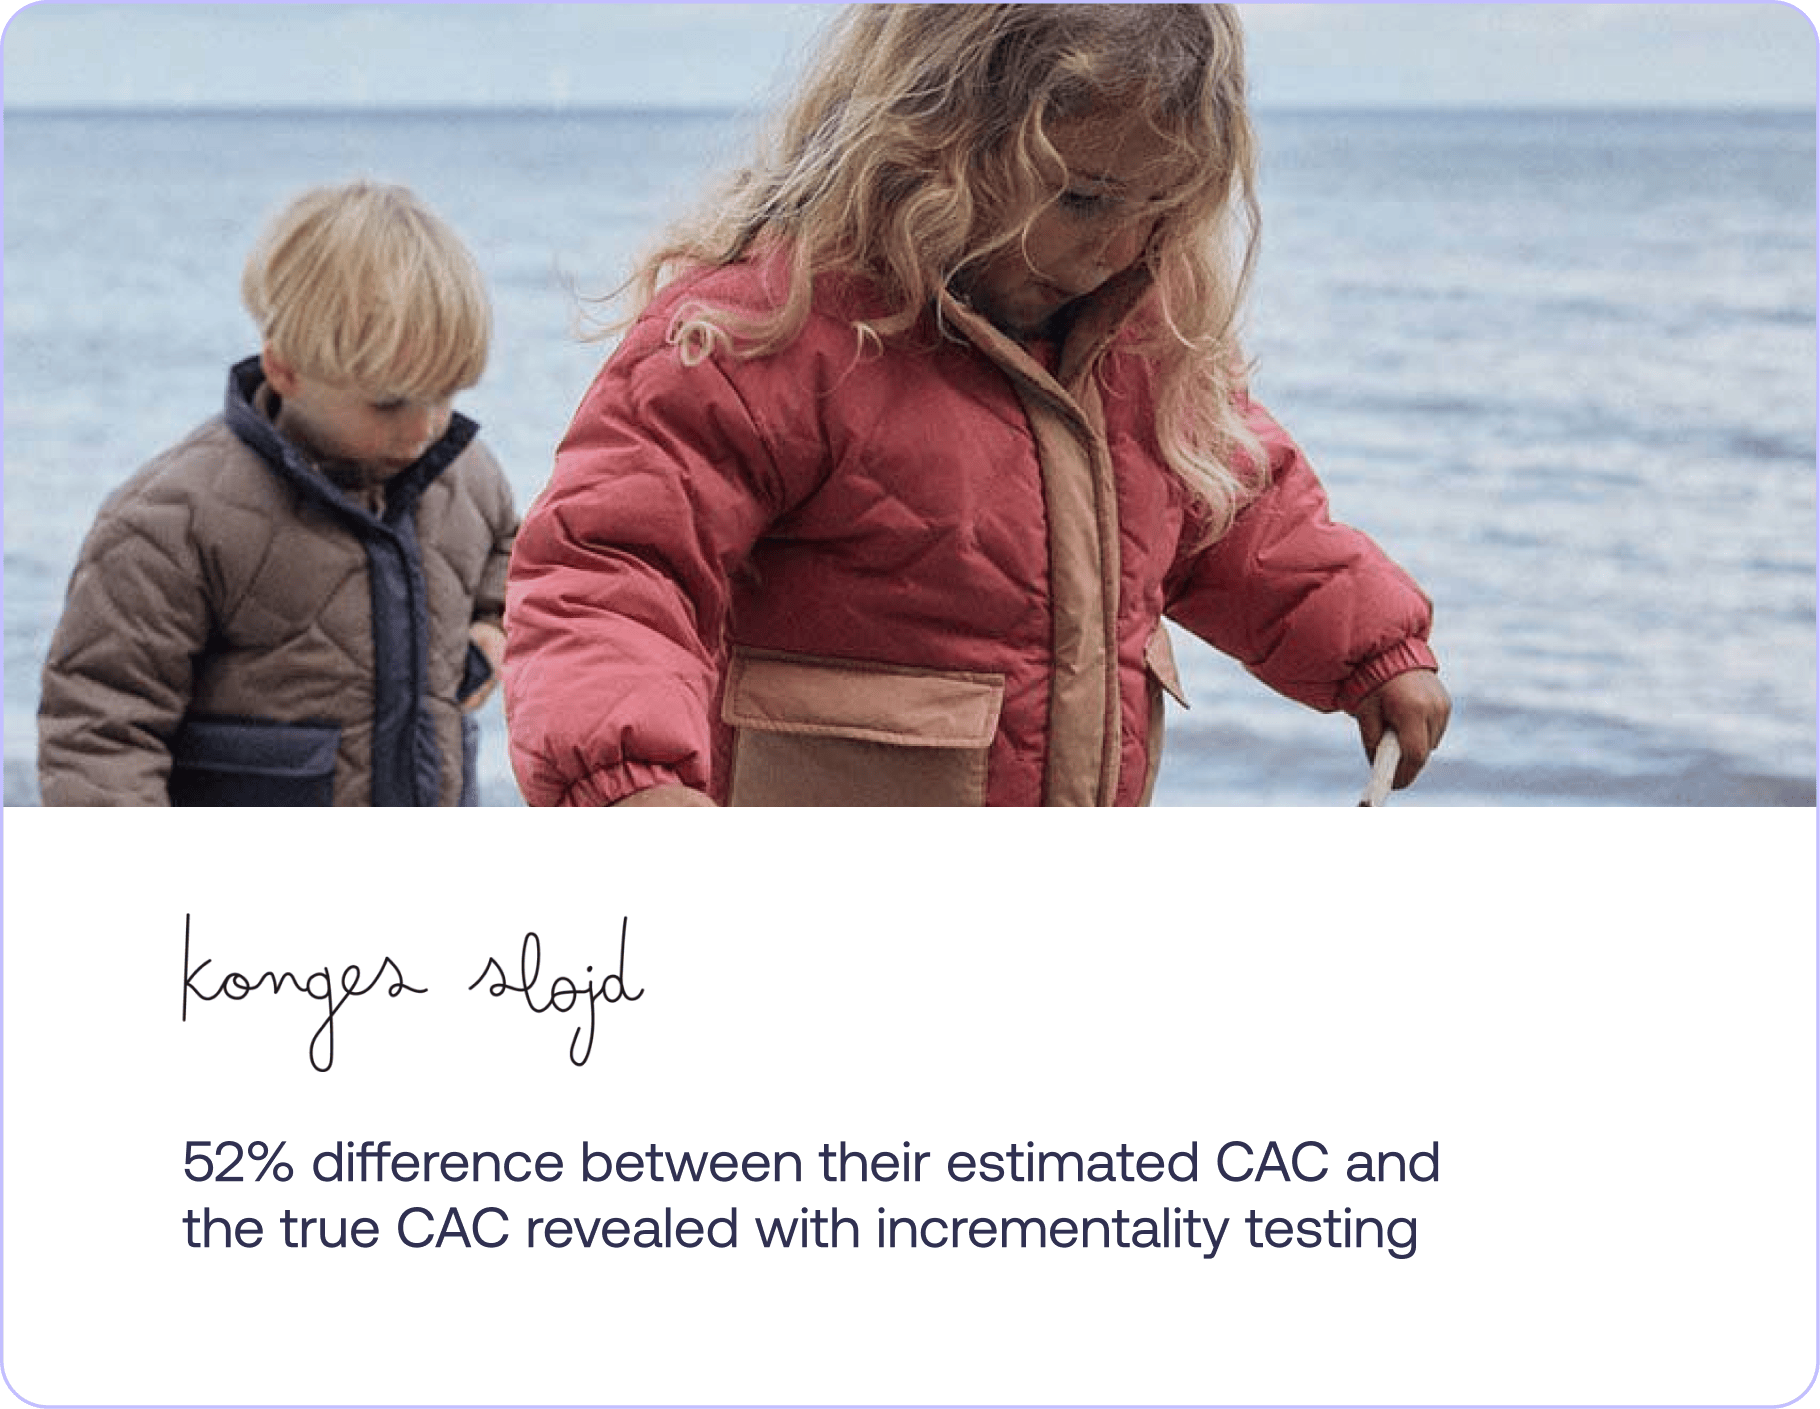
Konges Sløjd is a premium children’s lifestyle brand, known for its elegant Scandinavian designs and sustainable materials. From organic babywear to whimsical toys and nursery essentials, Konges Sløjd has grown a loyal following across Europe and beyond.

Facing Uncertainty Around Meta’s Reported Results

Like many fast-growing brands, Konges Sløjd invested heavily in Meta, allocating a significant share of their total marketing budget to the platform. But with multiple attribution models providing conflicting insights and platform-reported CACs (Customer Acquisition Cost) often appearing too low to be realistic, the team wasn’t sure what data to trust.

Sofie Lindgaard-Frantzen, Head of Ecommerce at Konges Sløjd said,

“We’ve mostly relied on ROAS from the platform. But with Facebook reporting one set of results and Google another, we knew we needed to dig deeper.”

Their core question going into this experiment was simple: Is Meta actually acquiring customers at the cost reported, or is its value being overstated?

Putting Meta to the Test with a Controlled Experiment

To uncover the true value of Facebook advertising, Konges Sløjd came to Polar to run a geo-based Causal Lift test across Denmark and Germany.

20% of the audience was withheld from all Meta campaigns to serve as the control group. The remaining 80% continued receiving business-as-usual campaigns. The experiment ran for 4 weeks, covering both acquisition and remarketing campaigns across both markets.

The test ran with one objective: to isolate and measure Facebook’s true impact on new customer acquisition, conversions, and downstream organic traffic.

To evaluate performance, the Causal Lift team established multiple benchmarks for comparison:

  • Meta’s click-through attribution (platform reported)
  • Multi-Touch Attribution
  • Causal Lift’s incremental measurement

By comparing these attribution methods side-by-side, the team could determine whether Meta’s reported performance aligned with reality and, ultimately, whether the current level of ad spend was truly justified.

Validating Meta’s True Incremental Impact vs. Meta’s Reported Metrics

Discovering True CAC to be Higher Than What Meta Reported

The incremental cost to acquire a new customer through Meta was approximately €152, significantly above Konges Sløjd’s internal benchmark of €100. To understand why there was such a gap, the team compared results across different attribution models to gain a more nuanced view of Meta’s performance.

*Values normalized to a base of 100. Actual CAC figures have been scaled for confidentiality.

Polar’s first-click attribution model showed a much higher CAC at €147, closely aligned with the incremental figure of €152.

What stood out most was that even the lowest possible CAC measured, €100, already exceeded their acceptable threshold. This made it clear that Meta’s actual performance was consistently more expensive than what the platform reports had suggested.

“I wasn’t expecting it to be that high. At that level, the incremental CAC is well above our average order value, which basically means we’re losing money on the first purchase. Even if it takes two or more repeat purchases to break even, that’s a problem.”

Highlighting the Halo Effect of Meta Campaigns

While Meta campaigns are often judged on immediate conversions, they are typically positioned at the top of the funnel, designed to increase brand presence and influence other channels indirectly. This broader impact, sometimes referred to as the halo effect, is difficult to capture through traditional attribution but well-suited to measurement through a geo-based Causal Lift experiment.

For Konges Sløjd, this wider effect became clear. Regions where Meta ads were running saw a 13.5% uplift in organic and branded sessions, including direct traffic and branded search. This confirmed that Meta was playing a downstream role in driving brand interest even when it didn’t directly convert users.

Polar’s Customer Journeys analysis added further validation. Many journeys that began with a Meta impression later converted through organic or Google brand search, reinforcing Meta’s role in shaping demand and contributing to overall performance across the funnel.

Reflecting on the experiment, Sofie shared,

“This was really helpful. Seeing the numbers on their own was concerning, but having a walkthrough and follow-up session gave me clarity on how to take action. Incrementality is new territory for many of us, and it’s not something you can evaluate easily without support.”

What’s Next for Konges Sløjd

Armed with a clearer picture of Meta’s incremental performance, Konges Sløjd is taking action:

  • Use First-Click Attribution as a New Benchmark: The team has shifted away from platform ROAS and now evaluates Meta campaign performance using Polar’s first-click attribution, which most closely reflects the true incremental value revealed in the test.
  • Improve or Cut Underperforming Campaigns: With the current Meta performance results, the team is focusing on optimizing or pausing the lowest-performing Facebook campaigns and monitoring for the next two weeks.
  • Test for Saturation in a Single Market: Konges Sløjd plans to increase Facebook budgets by 20% in one market to see if CPAs worsen, which would confirm saturation. Depending on the results, they’ll decide whether to expand audiences or shift spend to other markets.
  • Explore Branded Search Incrementality: Given the confirmed halo effect of Meta on branded search, the next planned experiment is a Causal Lift test on Google Brand campaigns. This will help the team determine whether their current spend is incremental or cannibalizing organic traffic.

“We spend a sizable amount of our Google budget on branded search. If most of that traffic would have come in organically anyway, that’s a huge opportunity to reallocate.”

What where your goals ?

💪

What are your marketing challenges ?

Facing Uncertainty Around Meta’s Reported Results

Like many fast-growing brands, Konges Sløjd invested heavily in Meta, allocating a significant share of their total marketing budget to the platform. But with multiple attribution models providing conflicting insights and platform-reported CACs (Customer Acquisition Cost) often appearing too low to be realistic, the team wasn’t sure what data to trust.

Sofie Lindgaard-Frantzen, Head of Ecommerce at Konges Sløjd said,

“We’ve mostly relied on ROAS from the platform. But with Facebook reporting one set of results and Google another, we knew we needed to dig deeper.”

Their core question going into this experiment was simple: Is Meta actually acquiring customers at the cost reported, or is its value being overstated?

🖥️

How did you monitor growth before Polar Analytics ?

Putting Meta to the Test with a Controlled Experiment

To uncover the true value of Facebook advertising, Konges Sløjd came to Polar to run a geo-based Causal Lift test across Denmark and Germany.

20% of the audience was withheld from all Meta campaigns to serve as the control group. The remaining 80% continued receiving business-as-usual campaigns. The experiment ran for 4 weeks, covering both acquisition and remarketing campaigns across both markets.

The test ran with one objective: to isolate and measure Facebook’s true impact on new customer acquisition, conversions, and downstream organic traffic.

To evaluate performance, the Causal Lift team established multiple benchmarks for comparison:

  • Meta’s click-through attribution (platform reported)
  • Multi-Touch Attribution
  • Causal Lift’s incremental measurement

By comparing these attribution methods side-by-side, the team could determine whether Meta’s reported performance aligned with reality and, ultimately, whether the current level of ad spend was truly justified.

Validating Meta’s True Incremental Impact vs. Meta’s Reported Metrics

Discovering True CAC to be Higher Than What Meta Reported

The incremental cost to acquire a new customer through Meta was approximately €152, significantly above Konges Sløjd’s internal benchmark of €100. To understand why there was such a gap, the team compared results across different attribution models to gain a more nuanced view of Meta’s performance.

*Values normalized to a base of 100. Actual CAC figures have been scaled for confidentiality.

Polar’s first-click attribution model showed a much higher CAC at €147, closely aligned with the incremental figure of €152.

What stood out most was that even the lowest possible CAC measured, €100, already exceeded their acceptable threshold. This made it clear that Meta’s actual performance was consistently more expensive than what the platform reports had suggested.

“I wasn’t expecting it to be that high. At that level, the incremental CAC is well above our average order value, which basically means we’re losing money on the first purchase. Even if it takes two or more repeat purchases to break even, that’s a problem.”

Highlighting the Halo Effect of Meta Campaigns

While Meta campaigns are often judged on immediate conversions, they are typically positioned at the top of the funnel, designed to increase brand presence and influence other channels indirectly. This broader impact, sometimes referred to as the halo effect, is difficult to capture through traditional attribution but well-suited to measurement through a geo-based Causal Lift experiment.

For Konges Sløjd, this wider effect became clear. Regions where Meta ads were running saw a 13.5% uplift in organic and branded sessions, including direct traffic and branded search. This confirmed that Meta was playing a downstream role in driving brand interest even when it didn’t directly convert users.

Polar’s Customer Journeys analysis added further validation. Many journeys that began with a Meta impression later converted through organic or Google brand search, reinforcing Meta’s role in shaping demand and contributing to overall performance across the funnel.

Reflecting on the experiment, Sofie shared,

“This was really helpful. Seeing the numbers on their own was concerning, but having a walkthrough and follow-up session gave me clarity on how to take action. Incrementality is new territory for many of us, and it’s not something you can evaluate easily without support.”

What were your needs ?

What’s Next for Konges Sløjd

Armed with a clearer picture of Meta’s incremental performance, Konges Sløjd is taking action:

  • Use First-Click Attribution as a New Benchmark: The team has shifted away from platform ROAS and now evaluates Meta campaign performance using Polar’s first-click attribution, which most closely reflects the true incremental value revealed in the test.
  • Improve or Cut Underperforming Campaigns: With the current Meta performance results, the team is focusing on optimizing or pausing the lowest-performing Facebook campaigns and monitoring for the next two weeks.
  • Test for Saturation in a Single Market: Konges Sløjd plans to increase Facebook budgets by 20% in one market to see if CPAs worsen, which would confirm saturation. Depending on the results, they’ll decide whether to expand audiences or shift spend to other markets.
  • Explore Branded Search Incrementality: Given the confirmed halo effect of Meta on branded search, the next planned experiment is a Causal Lift test on Google Brand campaigns. This will help the team determine whether their current spend is incremental or cannibalizing organic traffic.

“We spend a sizable amount of our Google budget on branded search. If most of that traffic would have come in organically anyway, that’s a huge opportunity to reallocate.”

Get in touch to learn how Polar
can help you grow

Schedule a demo

The fastest growing Shopify brands use Polar Analytics

Vervaunt Used Polar Analytics to Help a Brand Generate a Record-Breaking £113,000 in One Day
See how Vervaunt used Polar to help a brand scale ad spend to £113,000 in a single day
Shopify Plus
Read more
The Email Experience Streamlines 30+ Client Accounts with Polar Analytics
See how The Email Experience manages 30+ client accounts with Polar Workspaces
Shopify Plus
Read more
Joseph Joseph De-Risks Meta Reach Campaigns through Incrementality Testing with Causal Lift
See how Joseph Joseph de-risked a new TOFU strategy with Causal Lift
Shopify Plus
Read more