How Valabasas Fixed its Marketing Attribution with Polar
At a Glance
Okay, I’ve spent the last 2.5 hours stressing the model out and it is great. So great. Using that and the chat, I’ve gotten insights that every other model and view and platform missed.

About Valabasas
Valabasas is a US denim and streetwear brand selling online through Shopify, alongside wholesale and retail. The team is present on nearly all paid social channels, including Meta, TikTok, Pinterest, and Snapchat, alongside Google, with email and SMS through Klaviyo and Postscript.
A small in-house team makes the marketing decisions, supported by an outside growth partner. Every channel’s data lands in Polar, so the team works from one view of the business. Attribution is one part of that view: it decides which marketing touch gets credit for each sale.
The challenge: every ad platform claims the same sale
Meta, Google, and TikTok each report their own conversions, and the same order shows up in all three. When the Valabasas team compared those numbers against their own sales and spend reporting, the gaps were hard to explain. In Q2 the team had moved to judging every channel through the same 7-day click window.
In July 2026, the team asked Polar for an attribution audit. David Lawson wrote down exactly what he wanted the model to do.
His spec had five rules:
- Total credit per order equals 100%.
- The first non-direct click gets the most credit.
- Every later click still gets some.
- Credit falls with each later touch.
- Direct traffic never displaces a known marketing touch.
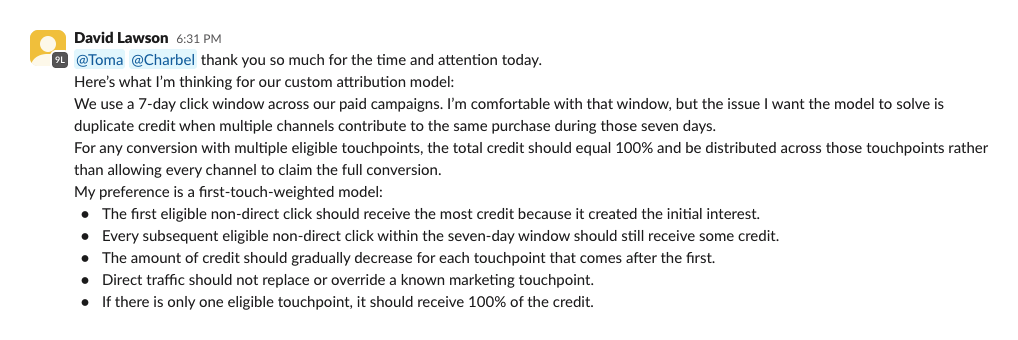
He closed the message with the reason behind the rules: “The main objective is to recognize that the first touch likely created the demand while still accounting for the channels that helped move the customer toward conversion.”
Build the model your brand actually needs
Every tool ships attribution out of the box: first click, last click, linear, u-shaped, time decay. None of those is a measurement. Each one is a recipe for splitting credit, written without knowing how your funnel is built or what your budget is meant to achieve.
A growing brand buying reach among people who have never heard of it needs the split to favor whatever opened the journey. A brand defending margin on an existing base needs it to favor whatever moved someone from browsing to buying. Same journeys, different question, different answer.
Valabasas had already written theirs down. Polar already held every touchpoint and every order in one place. None of the standard models matched this spec. Instead of asking the brand to pick the closest fit, Polar’s solution engineer proposed a custom one.
How the model works
- Touches inside the lookback window are split into marketing (paid, organic, email, referral) and Direct.
- Marketing touches are sorted in time order. The first click gets the biggest share.
- Each later click gets half the weight of the previous one.
- Direct and unknown touches get zero credit unless they are the only touches in the path.
- The lookback window stays adjustable, so the team can test 7 days against 30 without a rebuild.
Two days later, after a long session comparing models and reading conversion paths, the verdict changed.

In the same message, he asked for a second model. A standard U-shaped model gives 40% to the first touch, 40% to the last, and 20% to the middle. He wanted 40 / 30 / 30, with the middle split using the same decay. Polar shipped it on August 25, 2026, the day the request was confirmed.
Results
With the new models in place, the team used Ask Polar, Polar’s chat, to measure how long each channel takes to turn a first click into a purchase.
That reframed the channel mix. David Lawson draws the line plainly: “there are some channels that contribute to the demand creation and brand awareness, and there are some channels much more adept at converting that demand.” Judged on a 7-day click window alone, the channels that open the journey looked weak.
- One order, 100% of credit. No channel can claim a conversion that another channel also claims.
- Two custom models in the workspace, first-touch decay and a 40 / 30 / 30 U-shape, both with an adjustable lookback window.
- 17 custom reports built by the team, with Polar used on 29 of the last 30 days.
What’s next
- Sequential incrementality testing (geo-holdout tests that measure the true lift of a channel) is under discussion, starting with brand search and YouTube.
- The team is rolling the custom models into Ask Polar instructions and Claude via the Polar MCP for Black Friday planning.
Get the attribution model your team believes in
If your ad platforms all claim the same sale and no standard model fits how you think about demand, talk to us. Book a demo and bring your rules.
The fastest growing Shopify brands use Polar Analytics