Why Most Geo Tests Fail and How to Design One for Reliable Results
.png)
TL;DR
Geo Lift tests stand as one of the most powerful tools for measuring true marketing incrementality. When designed correctly, they provide clear, data-backed answers about what is actually driving growth.
On the surface, they look clean and simple: run ads in one state, compare results to the rest of the country.
But beneath the surface, that simplicity hides deep flaws. Poor region matching, wide confidence intervals, and unrealistic assumptions can lead to noisy, inconclusive, or misleading results.
Here's how you avoid those pitfalls and design Geo Lift experiments that deliver actionable results you can trust.
Why the ‘One State vs. Rest’ Test Doesn’t Work
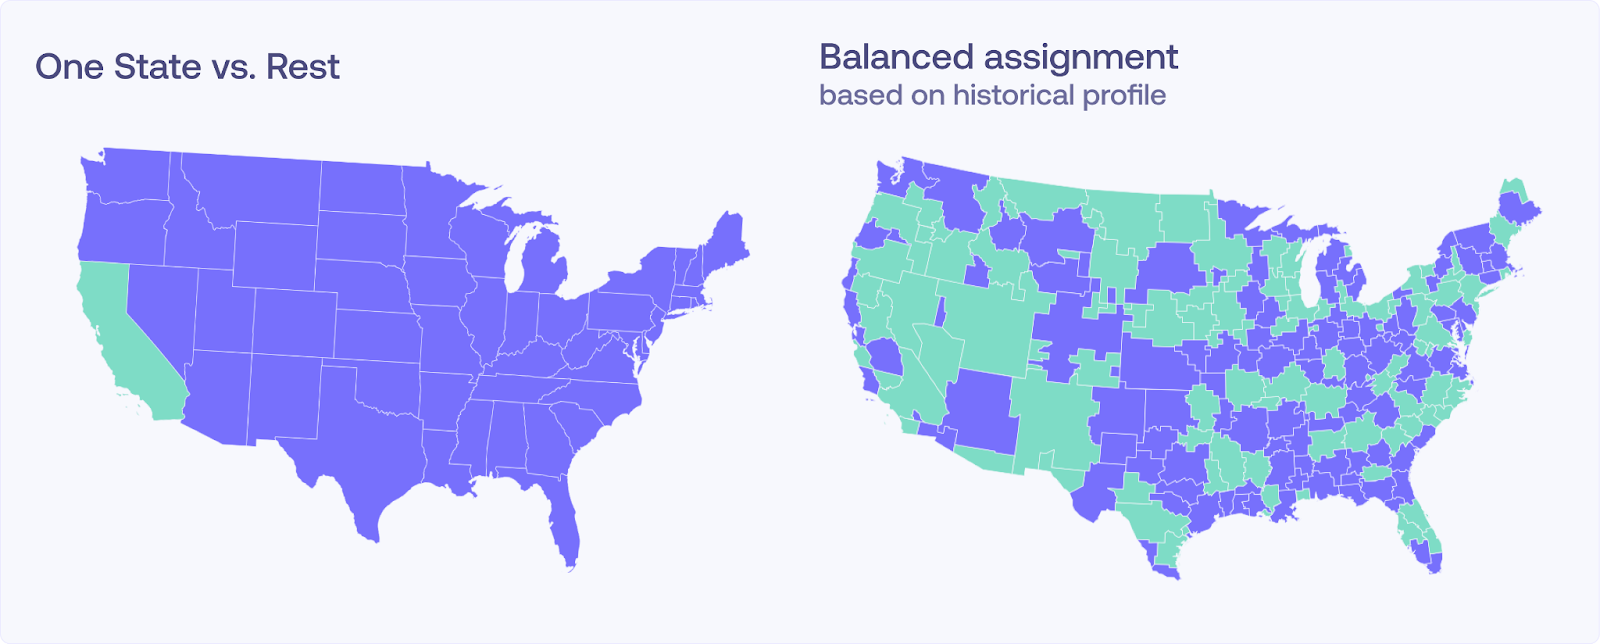
A common strategy is to run a campaign in one large state like California and compare performance to the rest of the country. On the surface, this seems straightforward, but it rarely holds up in practice. Why?
Different regions vary in more ways than just size. Consumer behavior, demographics, media exposure, and seasonality all play a role. Comparing a single state to the rest often results in a test full of noise rather than impact.
Takeaway: Your geo test is only as good as its comparison group.
The Problem with Wide Confidence Intervals
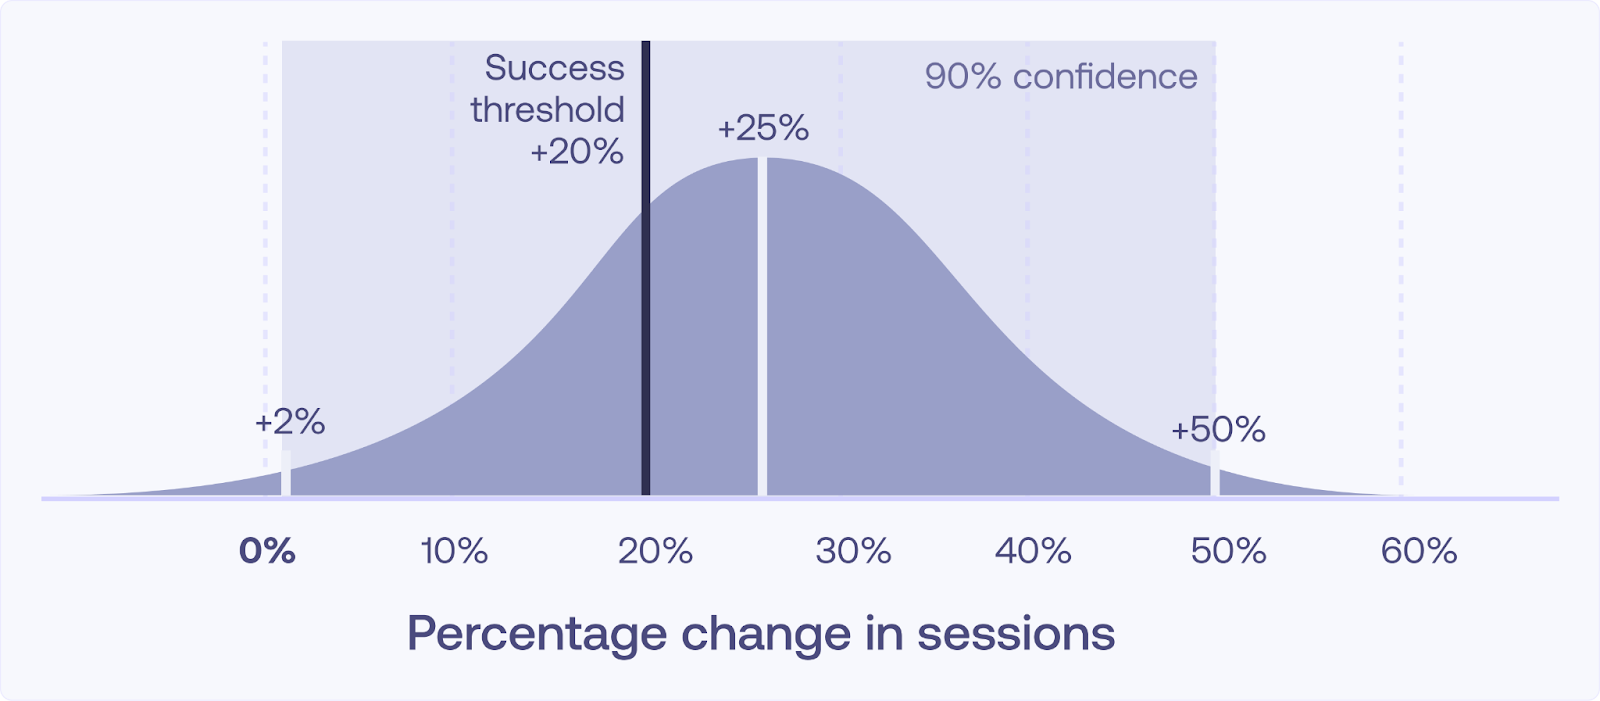
One of the most important elements of any geo test is managing uncertainty. Even if your test region shows a positive lift, how do you know that the lift is real and not just a random fluctuation?
Confidence intervals (CIs) indicate how sure you can be about your results. A wide confidence interval, such as “lift = 26% ± 24%”, is a large spread where the actual result could range dramatically from 2% to 50%. In other words, a confidence interval this wide indicates significant uncertainty, making the results practically meaningless.
If that lift maps to a Cost per Acquisition (CPA), the cost could be anywhere from $5 to $1000, which is fully unhelpful when evaluating performance.
These wide intervals typically happen when there are:
- Few data points: Testing only a handful of regions increases uncertainty.
- High variance in outcomes: Sales or conversions can vary significantly by region and over time, making it difficult to detect true impact.
- Imbalanced test/control groups: If the groups aren’t well matched, the added variability creates more noise, making results more unreliable.
The result is a test you can’t trust, and certainly can’t confidently make business decisions from.
Detecting a Lift vs. Using the Lift to Make Decisions
Many marketers focus on minimum detectable effect (MDE), the smallest lift a test can reliably detect. But, detecting a lift does not translate to being able to act on it. Ask yourself:
“Given my expected lift, will I get a tight enough confidence interval to make decisions?”
For example, if you’re aiming for a CPA of $20 and planning to spend $10,000, you would need a 10% lift to achieve that goal. But if your CI is ±5% and your estimated lift is only 10%, you can’t confidently determine whether the campaign is succeeding or failing since your true effect can range anywhere from 5% (resulting in a poor CPA) to 15% (a great CPA).
This is why it is essential to design for a margin of error you are willing to accept. It’s not just about detecting impact but knowing what to do next. For instance, if your MDE is 3%, then observing a lift of 13% or more would almost guarantee you are hitting your target CPA, giving you the confidence to scale the campaign or apply the strategy more broadly.
Takeaway: A good test isn't just statistically significant; it's designed around results that guide business decisions with confidence and clarity.
How Synthetic Controls Create Better Counterfactuals
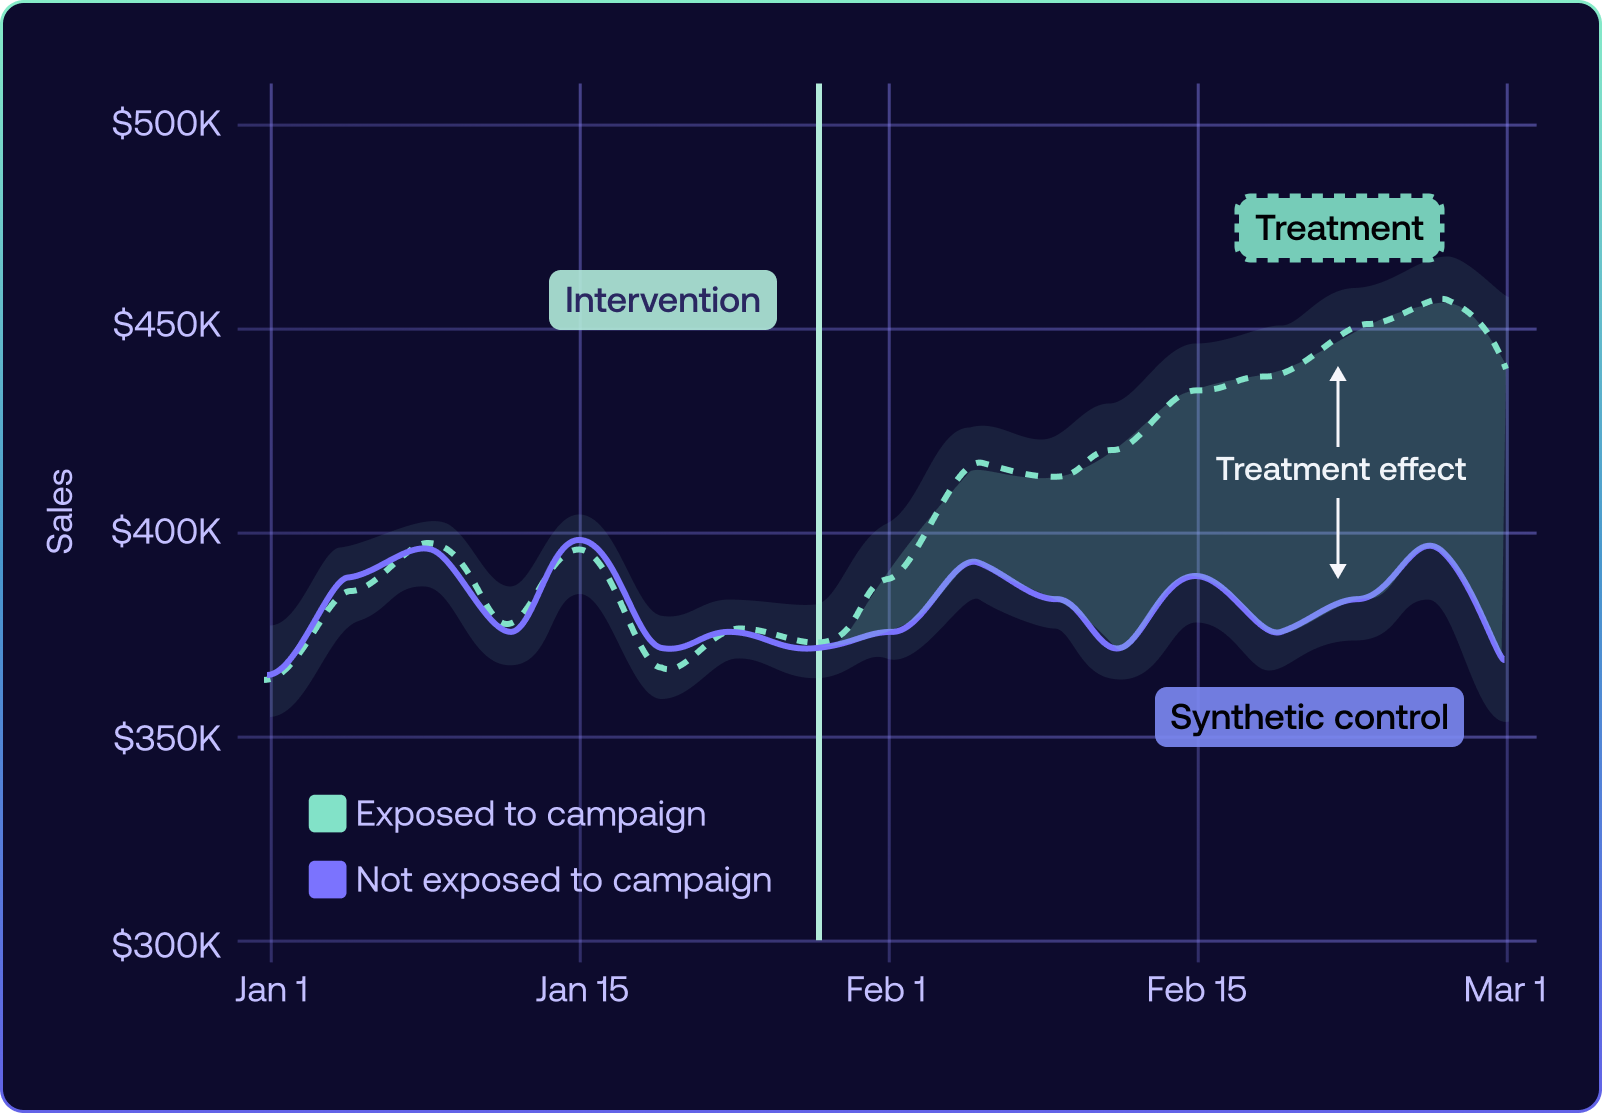
One of the most effective techniques in geo experiments is using synthetic controls to build a counterfactual, an estimate of what would have happened in the test regions if no ads had run.
Since you can’t observe both realities (ads vs. no ads) in the same region at the same time, synthetic controls use data from multiple other regions to build a weighted baseline that closely mirrors the test region’s historical behavior. This projects the expected outcome without the ad, without directly comparing one region to another.
For example, if you’re testing in California, your synthetic control might blend with different weights, Texas, New York, and Oregon to create a “ghost California” that mirrors its past trends. This reduces noise, accounts for regional differences, and leads to clearer lift estimates with tighter confidence intervals.
To handle uncertainty, Polar Analytics’ Causal Lift model includes an uncertainty band. If the test region’s actual results fall outside this predicted range, you have strong evidence of a statistically significant lift.
Causal Lift automates this process with model-driven synthetic control creation. The model trains on historical data and automatically selects and weights regions based on seasonality, trends, and other factors. This creates a highly accurate and customized baseline for every test, helping you clearly answer: “What would have happened without the ads? ”
How to Simulate Geo Lift Tests Before Spending Budget
Simulation is a powerful tool to confirm that your experiment is well-designed, reliable, and will ensure meaningful results before you commit to any budget. Modern geo testing tools like Causal Lift automate this simulation process, providing clarity and confidence upfront:
- Randomly assign regions repeatedly into test and control groups.
- Apply a simulated lift to the test group.
- Add realistic variability (noise) based on your historical data.
- Measure the simulated lift and calculate confidence intervals as if it were an actual test.
- Repeat this process hundreds or thousands of times (known as the Monte Carlo simulation).
By analyzing the range of results across simulations, you can estimate how often your test would detect a real lift. For example, if 90% of simulations show a significant result for a 10% true lift, your test is well-powered. If the intervals remain wide, you’ll know you need more regions or a longer test period.
Step-by-Step to Design a Reliable Geo-Lift Experiment
Building a robust Geo Lift test requires more than just picking regions randomly. Designing a reliable experiment is part strategy, part statistics. Follow these principles to deliver reliable results:
1. Choose Geographic Units Carefully (and Cluster if Needed)
Decide the geographic granularity you’ll test (city, county, DMA, or state). Cluster (group smaller areas) when needed to avoid spillover and make sure each unit has sufficient data and independence. Avoid units that are too granular, like individual ZIP codes, where factors like travel and media overlap can blur the line between test and control regions. This can heavily dilute or inflate your measured lift because your control group isn’t truly isolated from the ad exposure.
2. Balance Test and Control Groups
Use historical sales and traffic data to pick regions that behave similarly. Matching algorithms can help ensure your test and control groups are balanced and comparable.
3. Calculate Your Minimum Detectable Effect (MDE) and Confidence Interval
Decide on test duration (e.g., 4 weeks) and expected lift. Use power analysis (potentially with simulation) to confirm whether your test design can detect meaningful results. If your MDE is too high (meaning you might miss detecting the lift you’re looking for), add more regions or extend the test duration.
4. Run Simulations Before Launching
Before spending budget, simulate outcomes using historical data with artificial "lifts." This helps uncover potential issues like excessive variance from certain regions or inadequate sample sizes. Adjust your test design based on these insights to ensure accurate and actionable results.
5. Analyze Results with Synthetic Control Models
After completing your test, analyze results using statistical methods, like synthetic controls or difference-in-differences models, to measure lift accurately. Always check the confidence interval: if it includes zero or is too wide, interpret your results with caution.
Takeaway: "Always ask not just what lift did I see? " but "how sure am I of this lift? " Clear confidence intervals ensure your incrementality measurements are reliable and decision-ready.
Polar Analytics’ Causal Lift to Simply Advanced Geo Testing
Causal Lift was built to address the complexities of geo testing, offering:
- Simulation-driven planning: Uses simulations to estimate error margins and the minimum detectable effect (MDE) before your test begins. It clearly shows how long or how many regions you’ll need to detect your target lift accurately.
- Automatic region binning and randomization: Automatically clusters regions into balanced test and control groups, ensuring they’re comparable and reducing bias.
- Realistic error estimation: Employs sampling techniques to calculate accurate confidence intervals, giving you trustworthy margins of error for your results.
- Model-driven synthetic controls: Builds advanced predictive models using historical data to estimate exactly what would have happened without your campaign. This automated, data-driven baseline increases accuracy without requiring advanced statistical knowledge.
With Causal Lift, marketers no longer need advanced statistical knowledge to get reliable, actionable results from geo lift experiments.
Design Geo Lift Tests That Deliver Clarity
Geo Lift testing can dramatically improve your marketing efficiency, but only when done accurately. By thoughtfully designing your tests to manage uncertainty and provide decision-worthy insights, you ensure every marketing dollar spent delivers measurable growth.
Table of contents
Frequently asked questions