We've secured a $9M Series A funding from top B2B SaaS investors! 🎉. Read more on Techcrunch.

Weekly eCommerce Benchmarks
Compare Top KPIs by Industries

Analyze Metrics Like CAC, AOV, and ROAS with real-time data from 2,000+ Shopify Merchants
Fleur du mal
Konges slojd
Lemaire
nohow
Maniere de Voir
Volcom
Coes
Razor Group
Oneskin
State & Liberty
Warren James
Dyper
Bonsoirs
From Future
RSVP
Merci handy
Soi Paris
Yellowpop
Olipop
Almond Cow
Hero
Fanjoy
Soko Glam
Polène

Get your e-commerce benchmarks emailed

weekly

Uncover how your Shopify store metrics stack up. Make data-driven decisions with real-time benchmarks updated every week from over 2,000 brands.

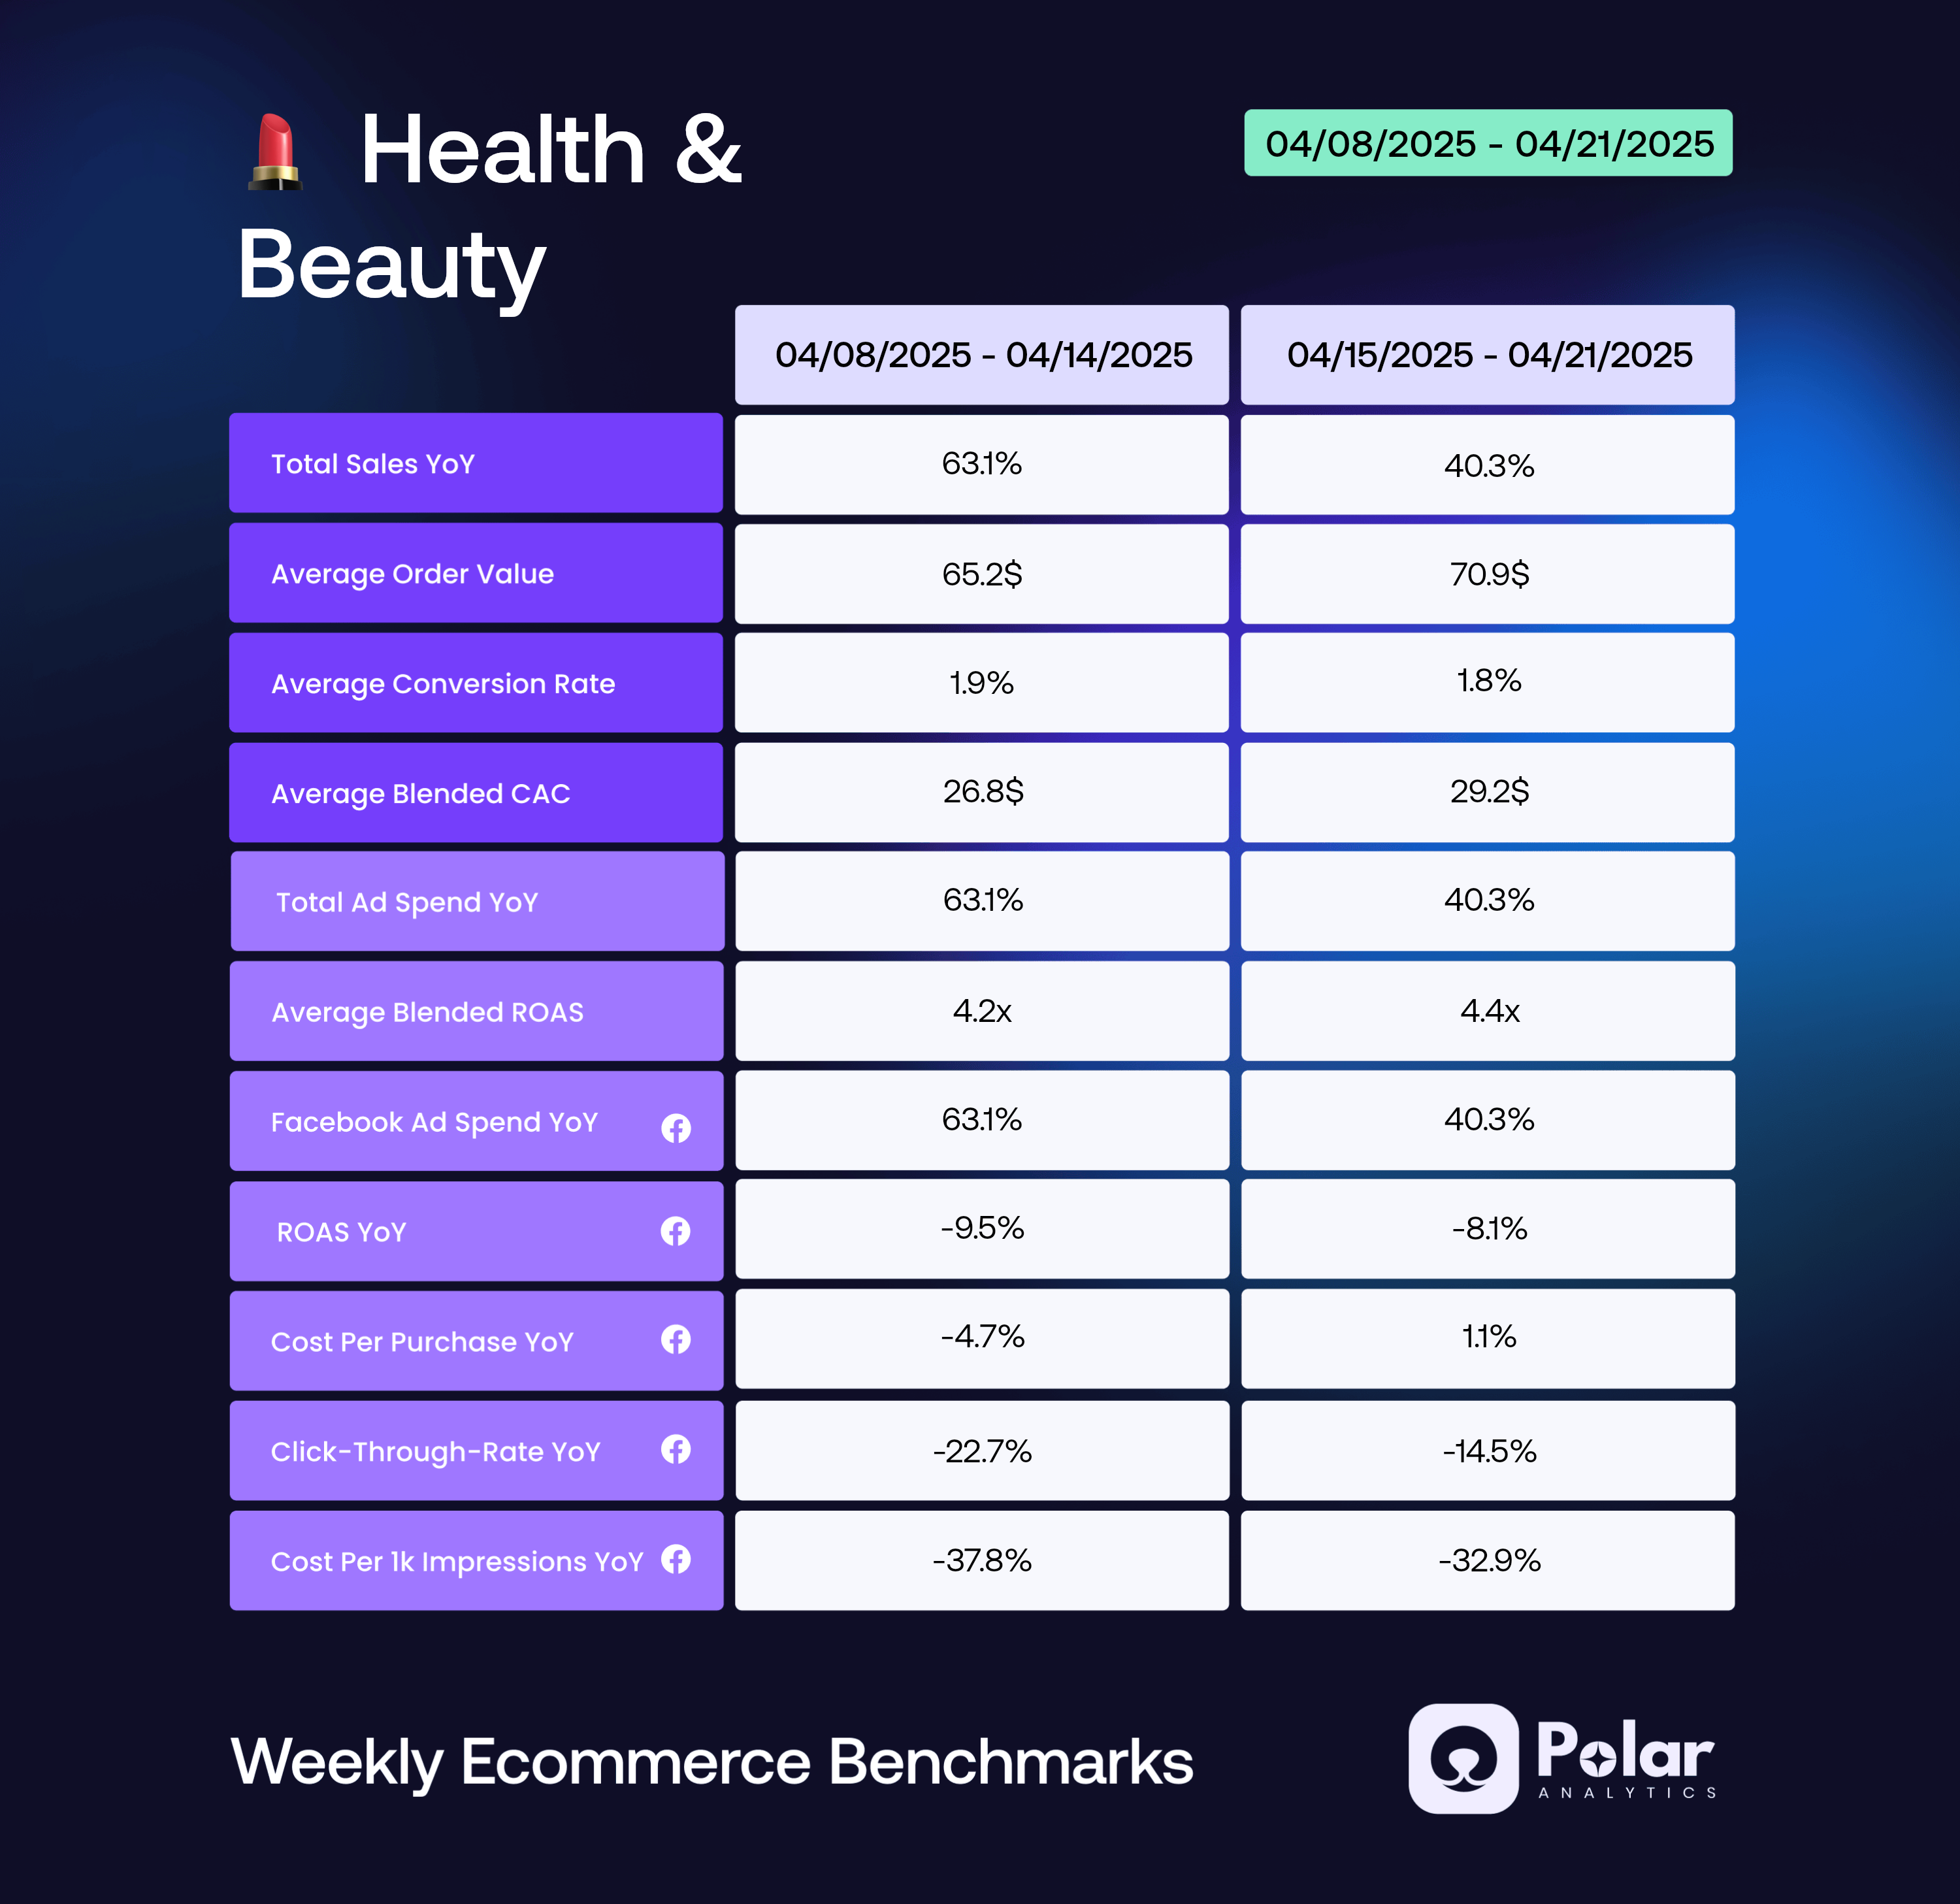
Last week benchmarks by Industries

Benchmark for fashion

Total sales decreased by 10.5% week-over-week, indicating a slowdown in sales activity. This could be due to a decrease in the conversion rate from 1.43% to 1.36%. Interestingly, the CAC dropped by 6%, suggesting more efficient customer acquisition. Despite a 4% decrease in AOV, the ROAS remained relatively stable, showing strong return on advertising spend. Year-over-year changes show a positive growth in total sales and conversion rate, but a concerning decrease in ROAS, which needs to be monitored closely.
fashion

Benchmark for Health & Beauty

Despite a YoY decrease, total sales improved week-over-week, implying a recovery trend. AOV decreased slightly, suggesting a shift towards lower-priced items or more promotions. Conversion rate dropped, indicating a need to optimize customer journeys. CAC increased, which may reflect competitive market conditions or less efficient campaigns. ROAS declined, pointing to a need for better ad spend optimization. Comparing these KPIs YoY and week-over-week provides actionable insights for future strategy.
Health & Beauty

Benchmark for Home & Garden

Despite a YoY increase in total sales of 4.17%, the past week saw a decrease in average conversion rate (-25.8%) and ROAS (-4.27%) compared to the same period last year. This indicates a less efficient ad spend, as CAC increased by 0.64%. However, AOV remained stable with a minor increase of 6.02%. It's crucial to optimize marketing efforts to improve conversion and ROAS for the coming weeks.
Home & Garden

Benchmark for Sporting Goods

Despite a decrease in total sales by 23.6% week over week, we notice an increase in the average conversion rate by 15.7%, which shows an improved efficiency in converting visits into sales. However, the Average Order Value (AOV) saw a small increase of 4.6%, reflecting a minor increase in customer spending. The Cost per Acquisition (CAC) remained almost constant, but the Return on Ad Spend (ROAS) decreased by 18%, indicating less return on each dollar spent on advertising. These trends suggest a need for improved ad strategies.
Sporting Goods

Benchmark for Arts & Entertainment

Despite a YoY decrease in total sales by 32.47%, the average conversion rate has increased by 12.89%, indicating high customer engagement. However, the rise in the average CAC by -18.36% is a concern, suggesting higher marketing costs. Interestingly, the ROAS has also increased by 36.84%, indicating a strong return on ad spend. The decrease in AOV by 2.19% YoY suggests customers are purchasing lower-value items, impacting total sales. These trends suggest a need to optimize marketing strategies to reduce CAC and improve AOV.
Arts & Entertainment

Join 2,200+ leading Shopify brands around the world using Polar Analytics to stop manually compiling their data

Start your free trial
Fleur du mal
Konges slojd
Lemaire
nohow
Maniere de Voir
Volcom
Coes
Razor Group
Oneskin
State & Liberty
Warren James
Dyper
Bonsoirs
From Future
RSVP
Merci handy
Soi Paris
Yellowpop
Olipop
Hero
Fanjoy
Almond Cow
Soko Glam
Polène

See why 2,200+ pioneering Shopify brands are partnering with Polar Analytics

Wild Man Drinking Company
Rating
5
Posted
July 13, 2023

The best Shopify analytics app! Polar has been super helpful for getting specific stats for our business that we can't get with other solutions. The ability to create custom metrics that filter and combine other existing metrics across our platforms is invaluable. Their support team has been great so far and I am looking forward to future updates as they continue to add new features. A little expensive but well worth it.

Text Link
View on Shopify App Store
Mayven
Rating
5
Posted
June 28, 2023

We have been using Polar Analytics app for several months now and we are very impressed with its capabilities and the expert CSM team. The app provides powerful features that allow us to track and analyze accurate data in one place. Moreover, the interface  is user friendly making it easy to navigate.

Text Link
View on Shopify App Store
Android Homme
Rating
5
Posted
June 20, 2023

Fantastic App, installed on 3 of my stores so far and will be using on any future developments. Support is fantastic and quick to offer assistance. Would recommend without hesitation.

Text Link
View on Shopify App Store